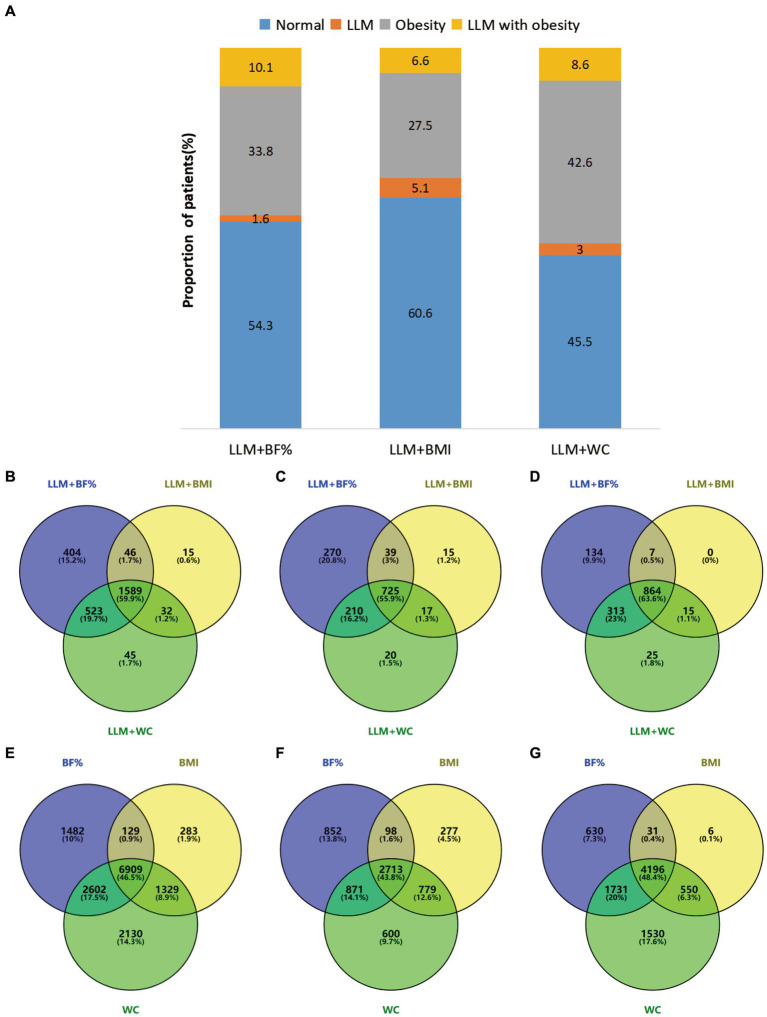
Figure 2.
(A) Presented the prevalence of normal, LLM, obesity, and LLM with obesity, as determined by different obesity definitions. (B–G) Employed Venn diagrams to illustrate the agreement among various diagnostic criteria in the total population and different genders. Specifically (B–D), respectively, examined the agreement of LLM with obesity in the overall population, males, and females, while (E–G) compared the agreement of obesity across three distinct obesity definitions in the overall population, males, and females. Diagram numbers show the number of participants. LLM, low lean mass; BMI, body mass index; BF%, body fat percentage; WC, waist circumference.

