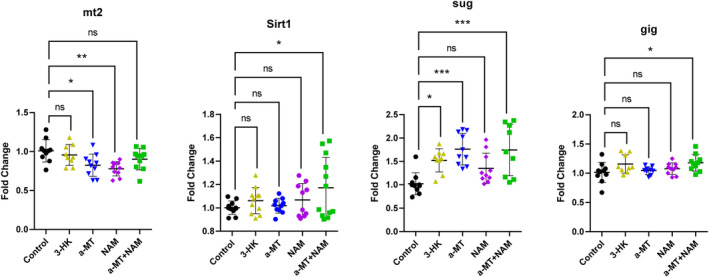
FIGURE 9.

Expression of longevity‐associated genes in Drosophila in response to 1 month treatment with either 3‐HK, α‐MT, NAM, or α‐MT + NAM. Fold change analysis of genes associated with longevity in Drosophila (n = 10 per treatment group). Data were analyzed using one‐way ANOVA with Tukey's multiple comparisons test. *p < 0.05, **p < 0.01, ***p < 0.001, ****p < 0.0001.
