Fig. 1.
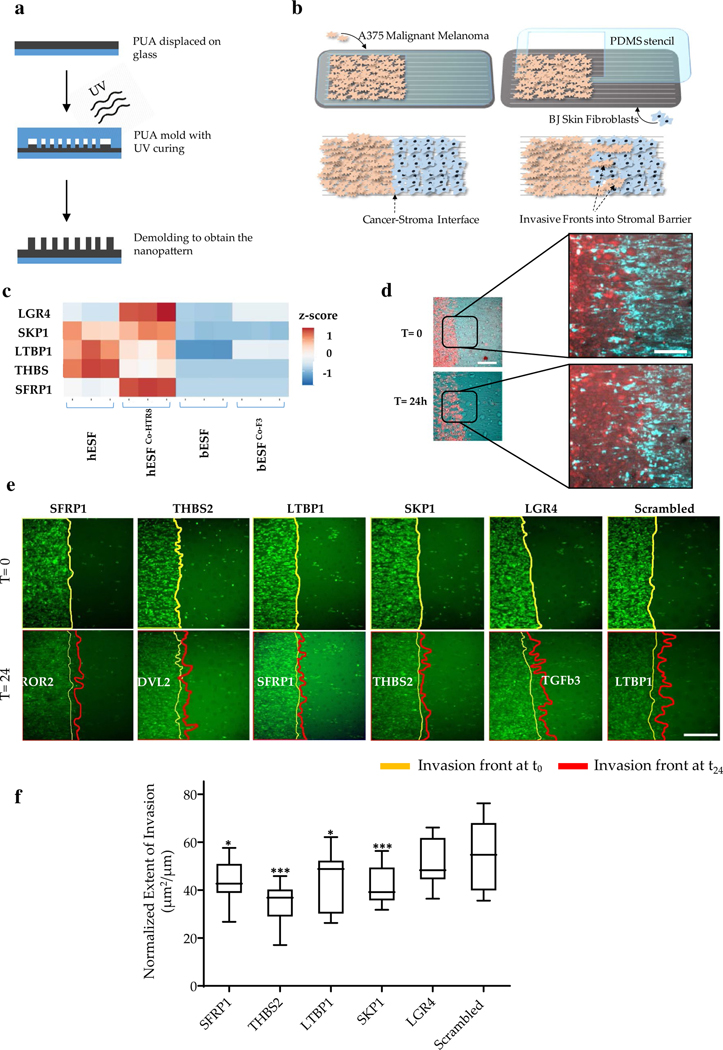
Multiplexed stromal gene knockdown to test melanoma invasion into skin stromal fibroblasts. a Schematic showing the fabrication workflow of the collective stromal invasion device substrate; PUA polyurethane; b Schematic showing assay setup and experimental workflow consisting of patterned seeding of labeled invasive A375 cells using stencils, and subsequent seeding of stromal BJ fibroblasts, and observing formation and penetration of invasive fronts; c Heatmap showing relative expression of selected genes with high expression in human endometrial stromal fibroblasts (hESFs) compared to bovine endometrial stromal fibroblasts (bESFs) with or without co-culture of the species-specific trophoblasts (HTR8, and F3, respectively); Heatmap shows the Z-score; d Representative image showing an invasive A375 front into the BJ stromal fibroblast monolayer at time 0 h and 24 h, scale bar = 200 μm. Inset shows a magnified view of the juxtaposed A375 (red) and BJ monolayer, scale bar = 100 μm; e Time-lapse images showing initial (yellow line, 0 h) and final (red line, 24 h) position of the invasive A375 fronts into the stromal BJ monolayer, wherein BJ cells are transduced with siRNA listed above the panels; f Quantified extent of A375 frontal invasion across different stromal BJ conditions listed in e. The end of boxes refer to as upper and lower quartile, the horizontal bar refers to the mean, and the end of lines refer to the lowest or highest data (*p value < 0.05, **p value < 0.005, ***p value < 0.0005)

