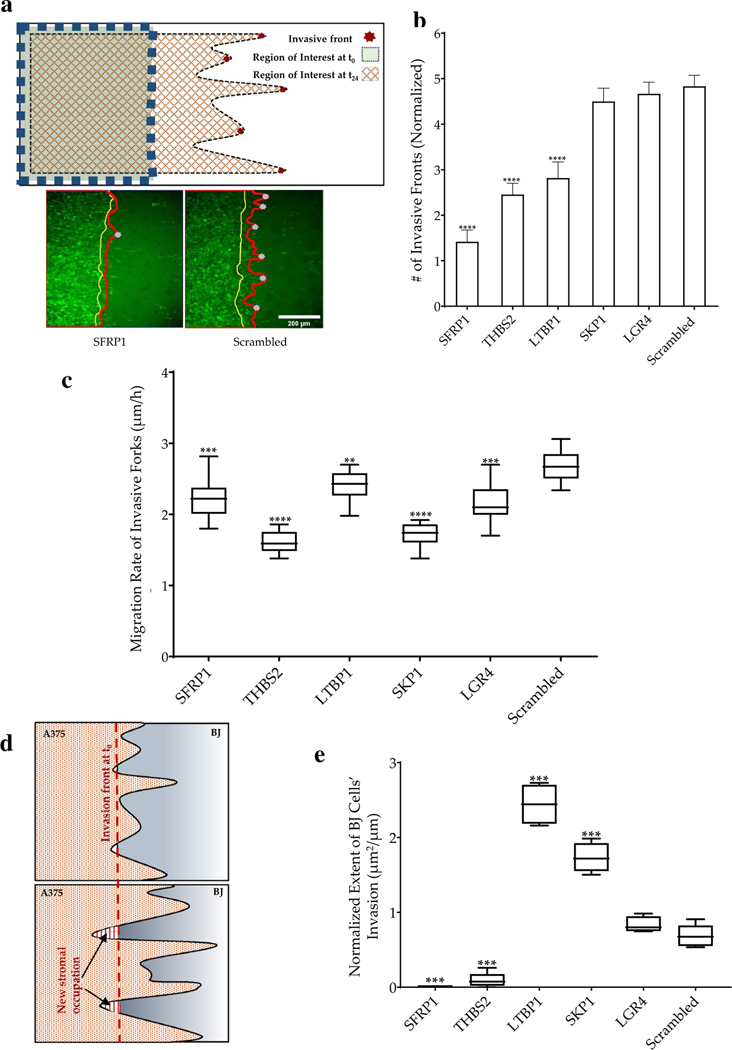
Fig. 2.
Phenotypic characterization of the invasive fronts. a Schematic showing formation of invasive fronts and identification of the leader cells in the invasive fronts; and images of invading A375 cells showing a representative example of the interface at time 0 (yellow line), and after 24 h (red line); Also shown below are examples of invasive forks penetrating BJ cells transduced with siRNA targeting SFRP1, or control; gray dots depict the tip of the invasive fronts; Scale bar = 200 μm; b Number of invasive fronts penetrating into BJ cells with different siRNA knockdowns. c Rate of penetration of invasive forks in all conditions listed in b. d Schematic showing new area occupied by stromal cells after 24 h (indicated by arrows). e The normalized extent of BJ cells’ invasion of the cancer cells. The end of boxes refer to as upper and lower quartile, the horizontal bar refers to the mean, and the end of lines refer to the lowest or highest data. Statistical significance was calculated for each siRNA as an unpaired t-test against the control Scr. (*p value < 0.05, **p value < 0.005, ***p value < 0.0005, ****p value < 0.0001). In each of the above figures, gene name refers to the siRNA knockdown of the specific gene

