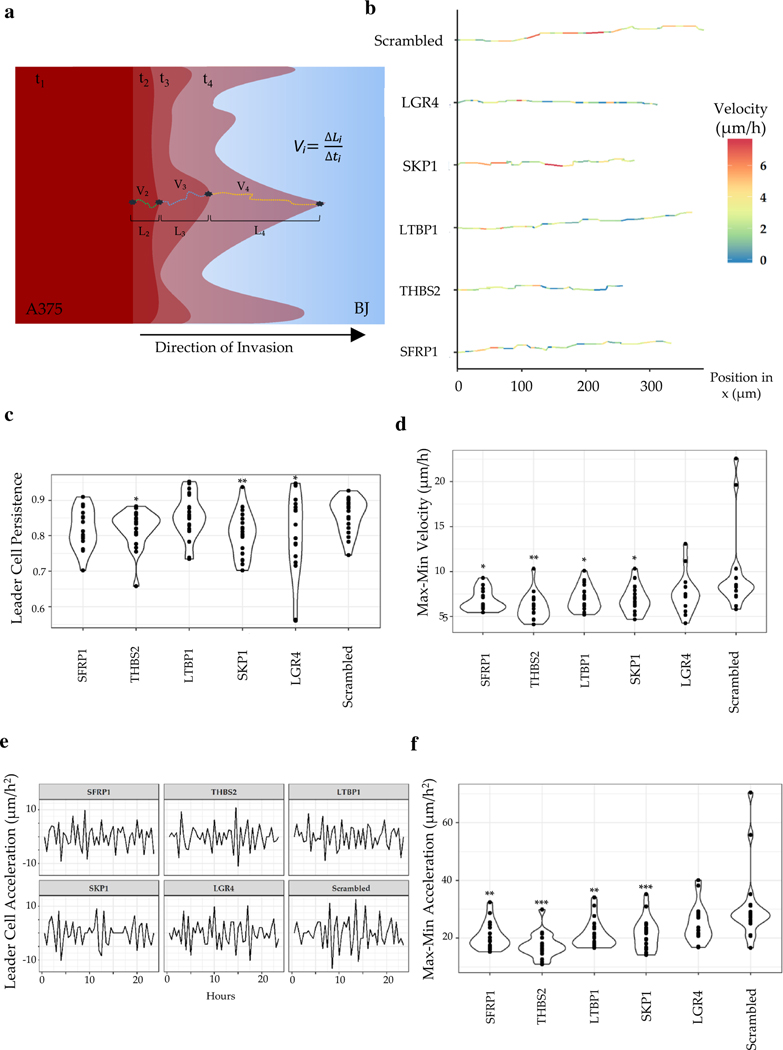
Fig. 3.
Phenotypic characterization of the speed and the path of the leader cells. a Schematic showing calculation of instantaneous velocity and migration rate of the tip of invasive forks calculated from acquired time-lapse images; ti: time-stamp, Vi: velocity, Li: length traversed by the leader cell in the i-th interval; b average trajectory of a representative leader cell for each condition; instantaneous velocity is color coded; c Violin plot showing persistence of movement of the leader cells; each dot refers to an instance of an invasive fork; d Difference in the maximal, and minimal velocity of penetrating A375 leader cells in the different stromal background; e Representative instantaneous acceleration of leader cells plotted over time. f The difference in the maximal and the minimal acceleration of penetrating A375 leader cells in the different stromal background. Statistical significance was calculated for each siRNA as an unpaired t test against the control Scr. (*p value < 0.05, **p value < 0.005, ***p value < 0.0005)

