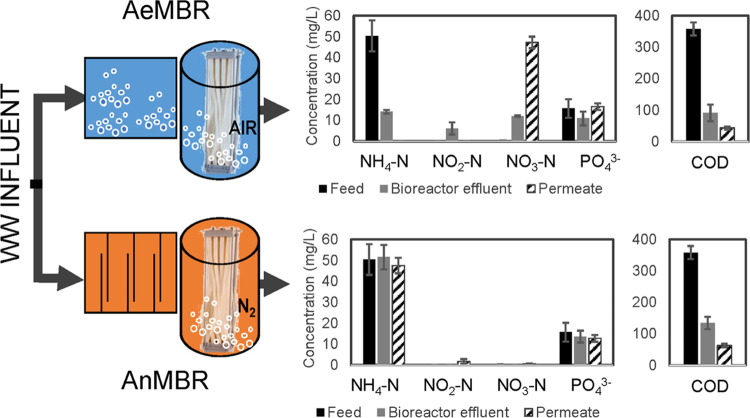
Figure 1.
Schematic of the laboratory-scale AeMBR and AnMBR treatment systems and their average nutrient and COD concentrations for N = 3 treatment cycles. For AeMBR, an aeration tank preceded the submerged membrane bioreactor (MBR) tank, while for AnMBR, an anaerobic baffled reactor preceded the MBR tank. For each experiment, a 48 h composite sample of wastewater influent was collected. The duration of the composite sampling of the aerobic and anaerobic membrane permeates corresponded to their hydraulic retention times (24 h for the AeMBR and 48 h for the AnMBR).

