Fig. 4.
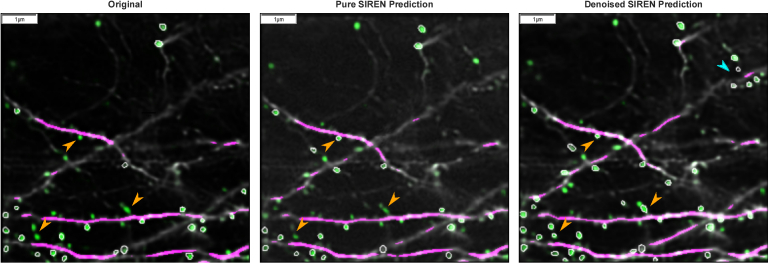
Spine Recovery. Comparison of the dendritic spine and dendrite segmentation by DeepD3 of the originally acquired image (left), the pure SIREN prediction (middle), and the denoised SIREN predictions (right). Green pixel intensities denote the probability of being a spine. Green pixel areas with white borders were annotated as a spine. Orange arrowheads point to pixel areas, which have a medium or low probability of being a spine and are therefore not annotated as a spine in the originally acquired image (and the pure SIREN prediction), but have an increased probability of being a spine and are therefore annotated as a spine in the denoised SIREN predictions. The blue arrowhead points to spines identified in the denoised SIREN predictions, which had zero probability of being a spine in the originally acquired image. The effect of a higher number of annotated spines in the denoised SIREN predictions than in the originally acquired image occurs if the pure SIREN prediction already has a low noise level, which is further reduced by the denoiser network and falls below the noise level of the originally acquired image. All reconstructed planes including the annotations from DeepD3 are shown in the video Visualization 1 (4.1MB, mp4) in the supplementary material, comparing pure SIREN predictions, denoised SIREN predictions, and linear interpolation.

