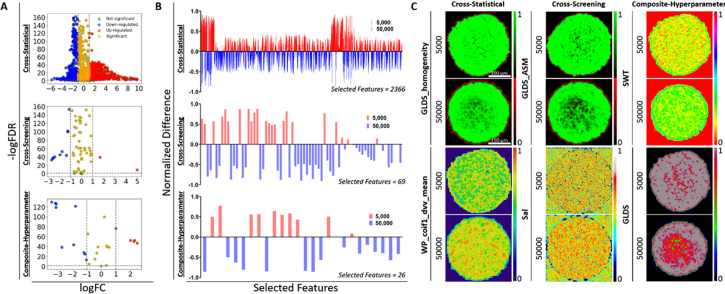
Fig. 5.
The statistics and difference of superficial and spatial features in OVCAR-8 MCTS. A, volcano plot of the difference among selected features. B, the normalized difference of selected features in the cross-statistical, cross-screening, and composite-hyperparameter. C, the representative images of the first two highest weight features of OVCAR-8 MCTS with different cell numbers in the cross-statistical, cross-screening, and composite-hyperparameter.

