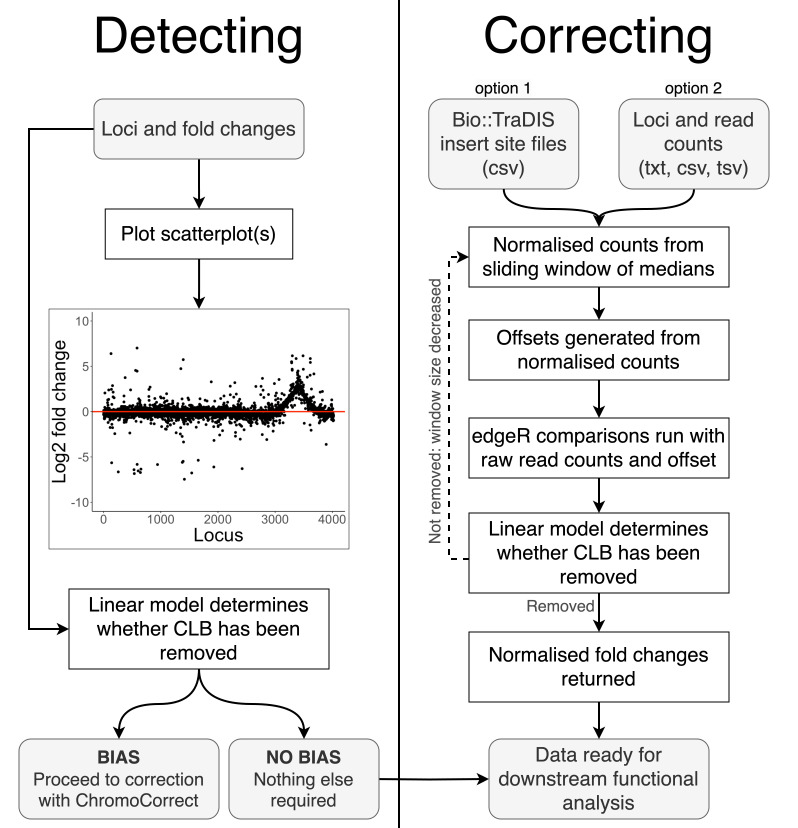
Fig 3.
Schematic of pipeline for detecting and correcting chromosomal location bias using ChromoCorrect. Gray boxes indicate user input or output, and white indicates automated steps. Detecting requires the log2 fold changes of each locus to plot a scatterplot of fold change by chromosomal position, which graphs trends in the fold changes for the user to visualize the pipeline’s assessment. The app and the R console display a message recommending normalization if chromosomal location bias is detected by a fitted linear model. Correcting requires read counts per locus in a txt, csv, or tsv file format, which are then normalized using a sliding window of medians with a default size of 500. An offset matrix is generated from the normalized counts to input along with the raw read counts into edgeR. A linear model is fitted again during correction to determine whether the default sliding window is small enough to capture the trend and repeats the normalization procedure with a smaller window otherwise. The corrected analysis is returned after the normalization is complete.

