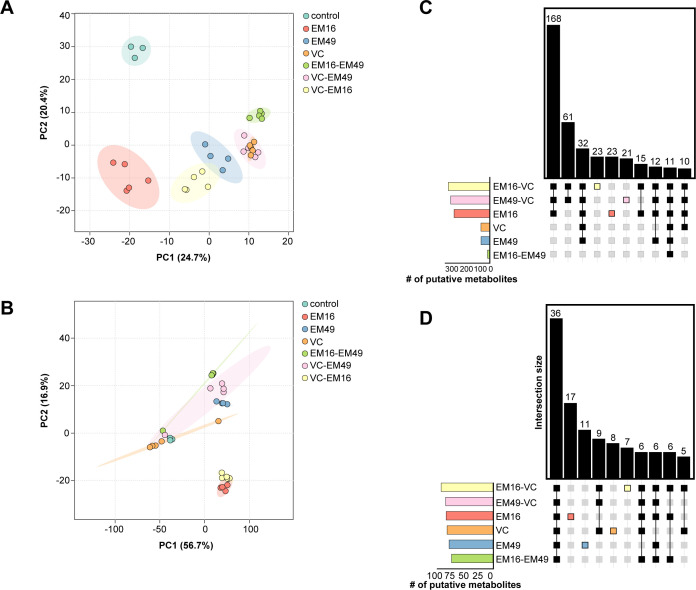
Fig 2.
Principal component analysis (PCA) plot and UpSet plot showed metabolite variation among different culture conditions. PCA for metabolites observed in (A) ethylacetate fraction and (B) aqueous fraction showed clear separation among culture conditions. The replicates are closer together, while culture groups are well separated along the PCA space. UpSet plot showing the number of putative metabolites that are present in either multiple-culture condition or present in only a specific-culture group for (C) ethylacetate and (D) aqueous fractions. Only a subset of the UpSet plot is shown to show the number of metabolites shared among different sample groups.

