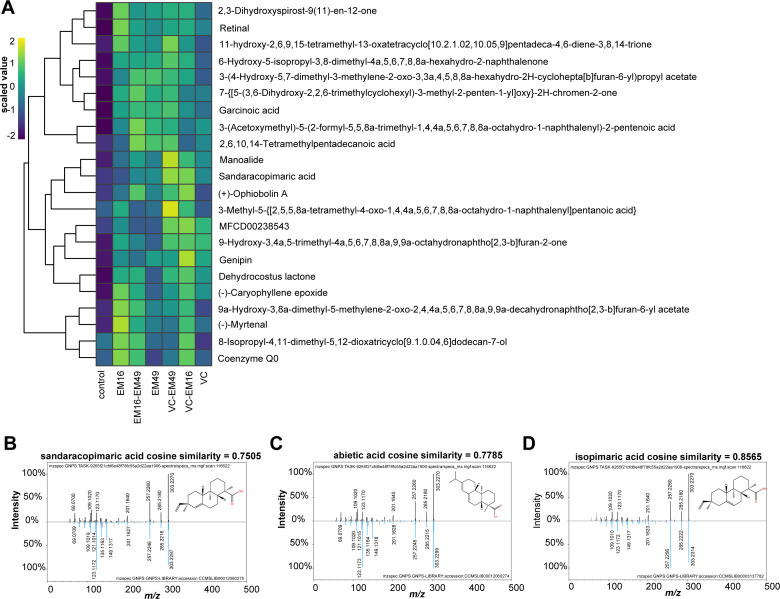
Fig 4.
Prenol lipids relative abundance varied among culture conditions. (A) A heatmap illustrates the relative abundances of selected prenol lipids metabolites that varied in their abundance among culture conditions in ethylacetate fraction. These putative identifications were the result of an untargeted metabolomics analysis using Compound Discoverer. For each compound, the average intensity across biological replicates was Log10 transformed into a scaled value. Mirror match images for (B) sandaracopimaric acid, (C) abietic acid, and (D) isopimaric acid. The experimentally observed MS/MS spectrum is shown at the top, and a representative MS/MS spectrum from a pure standard is shown in blue color at the bottom.

