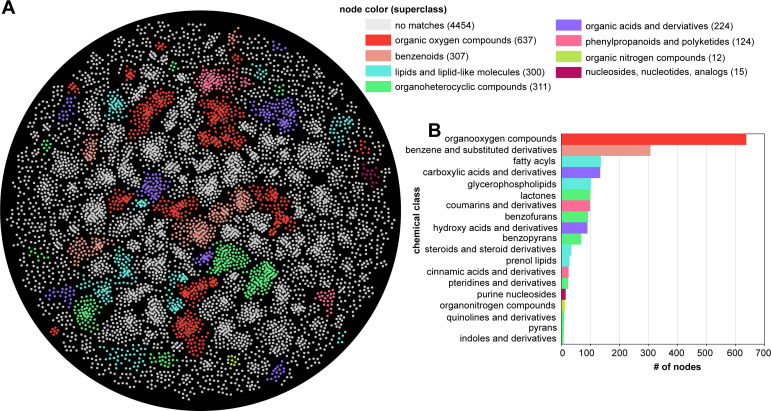
Fig 5.
Classical molecular network uncovered predominant annotated and unannotated MS/MS spectra. (A) The GNPS-derived molecular network was visualized by the Cytoscape software. Each node represents an MS/MS spectrum from this study. Nodes colored white represent unannotated MS/MS spectrum, and colored nodes represent an MS/MS spectrum associated with a putative metabolite annotation with a relatively high spectral similarity score (correlation >0.7). Nodes with putative annotations were annotated by the MolNetEnhancer workflow in GNPS to illustrate the different superclass annotations. Only a subset of the molecular network is shown by removing subnetworks with fewer than six nodes. (B) A bar plot shows the number of metabolites belonging to a chemical class reported by the MolNetEnhancer workflow in GNPS. The full molecular network and associated chemical classes are illustrated in Fig. S4.

