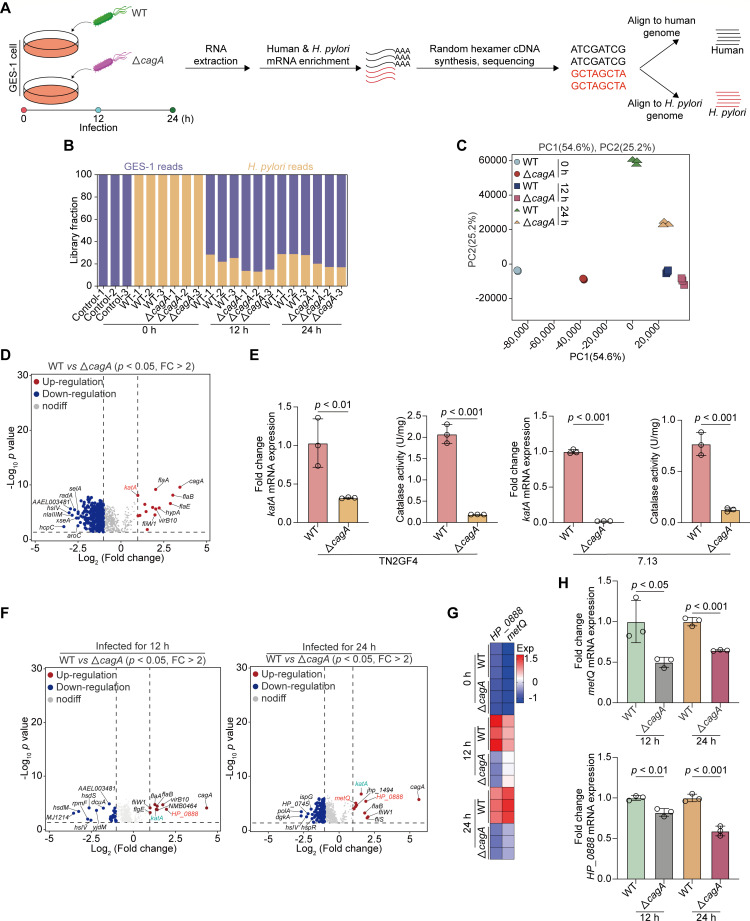
Fig 1.
Identification of host-induced H. pylori-specific stress responses using dual RNA-Seq. (A–D) GES-1 cells were infected with WT or cagA-mutated H. pylori TN2GF4 strains (MOI 100) for 3 h and then exposed to gentamicin (100 µg/mL) for 12 or 24 h to eliminate the extracellular bacteria as detailed in “supplemental Materials and Methods.” (A) Experimental workflow for dual RNA-seq RNA extraction, library preparation, and sequencing processing. (B) The proportions of reads aligned to H. pylori or GES-1 cells in each library. On average, there are 46 million reads per library: 71.6% of the reads aligned to the human genome and 28.4% to the H. pylori genome. (C) Principal component analysis (PCA) of the H. pylori transcriptome from different experiment conditions. (D) Volcano plot showing the DEGs obtained from WT H. pylori TN2GF4 strain compared with cagA-mutated TN2GF4 strain at time 0 using the DESEq2 toolkit. P value < 0.05 was considered statistically significant, Benjamini-Hochberg adjusted two-sided Wilcoxon test. (E) Total mRNA or proteins were extracted from WT or cagA-mutated H. pylori TN2GF4 (left) or 7.13 (right) strains. The expression levels of katA mRNA and catalase activity were determined. H. pylori 16S rRNA was used as the loading control for katA mRNA. (F) Volcano plot showing the DEGs obtained from WT H. pylori TN2GF4 strain compared with cagA-mutated TN2GF4 strain after coculturing with GES-1 cells for 12 (left) or 24 h (right). P value < 0.05 was considered statistically significant, Benjamini-Hochberg adjusted two-sided Wilcoxon test. (G) Heatmap showing the expression of ATP-binding cassette (ABC) transporter-related genes, metQ and HP_0888, in WT or cagA-mutated H. pylori TN2GF4 strains after coculturing with GES-1 cells for 0, 12, or 24 h. Color coding was based on normalized expression levels. (H) GES-1 cells were infected with WT or cagA-mutated H. pylori TN2GF4 strains (MOI 100) for 3 h and then exposed to gentamicin (100 µg/mL) for 12 or 24 h to eliminate the extracellular bacteria. The expression levels of metQ (upper) and HP_0888 (down) mRNA were determined. H. pylori 16S rRNA was used as the loading control. All the quantitative data were presented as means ± SD from three independent experiments. *P < 0.05, **P < 0.01, and ***P < 0.001.

