Fig 2.
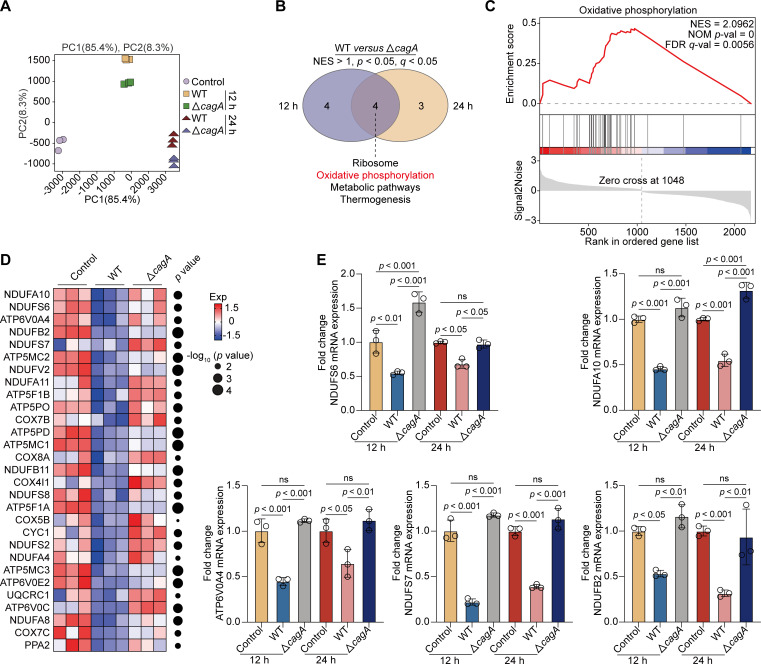
H. pylori cagA activated oxidative phosphorylation by disrupting the electron transportation. (A–D) GES-1 cells were infected with WT or cagA-mutated H. pylori TN2GF4 strains (MOI 100) for 3 h and then exposed to gentamicin (100 µg/mL) for 12 or 24 h to eliminate the extracellular bacteria. (A) PCA diagram showing the host cell transcriptome from different experiment conditions. (B) Venn diagram showing the number of GSEA-enriched biological pathways in GES-1 cells infected with WT versus cagA-mutated H. pylori TN2GF4 strains for 12 (left) or 24 h (right), with four pathways including oxidative phosphorylation (red) being simultaneously enriched in both two timepoints. (C) GSEA enrichment plot showed that the “oxidative phosphorylation” pathway was enriched in GES-1 cells infected with WT versus cagA-mutated H. pylori TN2GF4 strains for 24 h. (D) Heatmap showing the expression of ETC-related genes in uninfected GES-1 cells or cells infected with WT or cagA-mutated H. pylori TN2GF4 strains for 24 h. Dot size indicates the −log10 transformed P values, color coding based on normalized expression levels. (E) GES-1 cells were infected with WT or cagA-mutated H. pylori TN2GF4 strains (MOI 100) for 3 h and then exposed to gentamicin (100 µg/mL) for 12 or 24 h to eliminate the extracellular bacteria. The mRNA expression of NDUFS6, NDUFA10, ATP6V0A4, NDUFS7, and NDUFB2 was determined. β-Actin was used as the loading control. All the quantitative data were presented as means ± SD from three independent experiments. *P < 0.05, **P < 0.01, and ***P < 0.001.

