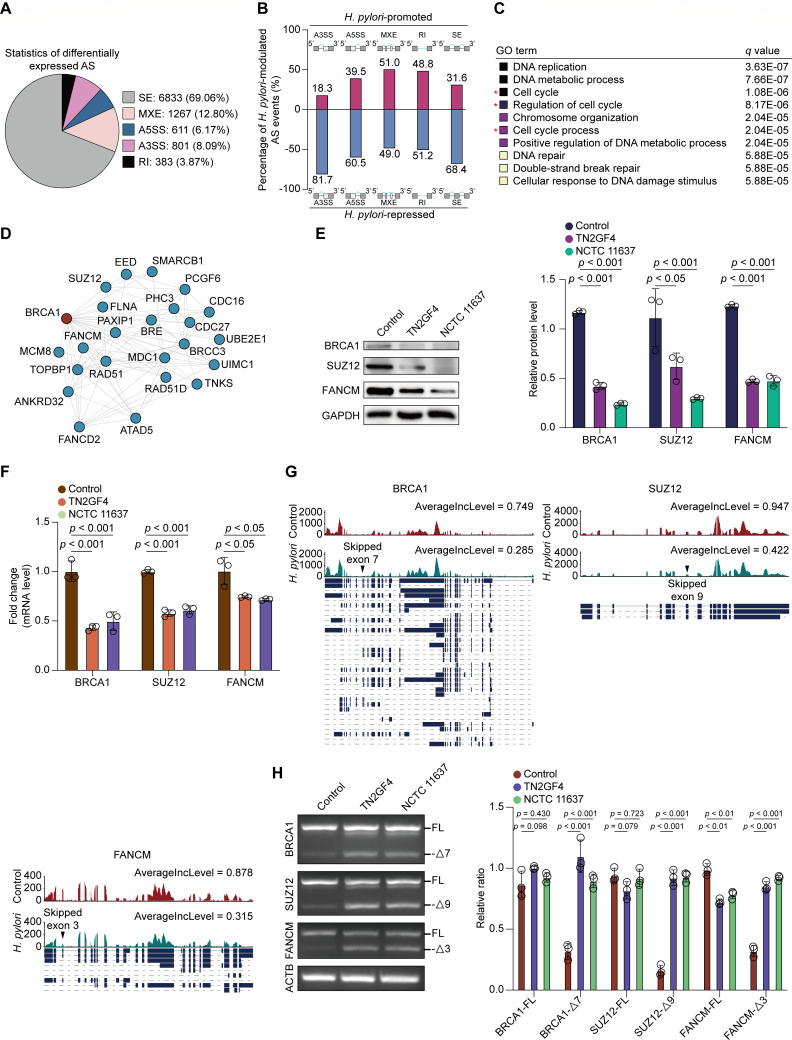
Fig 4.
H. pylori infection modulated mRNA splicing of functional genes that were involved in cell cycle process. (A–D) GES-1 cells were infected with WT H. pylori TN2GF4 strain (MOI 100) for 3 h and then exposed to gentamicin (100 µg/mL) for 24 h to eliminate the extracellular bacteria. (A) Pie charts showing the proportion of each type of significantly altered splicing events in H. pylori-infected GES-1 cells compared with the controls using the rMATS algorithm. (B) Percentage of H. pylori-promoted or repressed splicing events in GES-1 cells. (C) GO annotation of the top 10 enriched biological pathways using the functional genes affected by H. pylori-promoted splicing events. Colored squares represented the q value (black, small; yellow, big). (D) The protein-protein interaction network for functional genes involved in the cell cycle process based on the STRING database. (E and F) GES-1 cells were infected with H. pylori TN2GF4 or NCTC11637 strains (MOI 100) for 3 h and then exposed to gentamicin (100 µg/mL) for 24 h to eliminate the extracellular bacteria. (E) The protein levels of BRCA1, SUZ12, and FANCM were determined and quantified in uninfected GES-1 cells or cells infected with H. pylori TN2GF4 or NCTC 11637 strains for 24 h. GAPDH was used as the internal control. (F) The mRNA expression of BRCA1, SUZ12, and FANCM was determined in uninfected GES-1 cells or cells infected with H. pylori TN2GF4 or NCTC 11637 strains for 24 h. (G) Exon skipping in the seventh exon of BRCA1, the nineth exon of SUZ12, and the third exon of FANCM as visualized by the IGV software. Black arrowheads indicate splicing sites. (H) GES-1 cells were infected with H. pylori TN2GF4 or NCTC11637 strains (MOI 100) for 3 h and then exposed to gentamicin (100 µg/mL) for 24 h to eliminate the extracellular bacteria. RT-PCR analysis of alternative splicing patterns of the changed splicing genes in control and H. pylori-infected GES-1 cells. β-Actin was used as the internal control. The expression of full-length and exon-skipping isoforms of the three genes was quantified. All the quantitative data were presented as means ± SD from three independent experiments. *P < 0.05, **P < 0.01, and ***P < 0.001.

