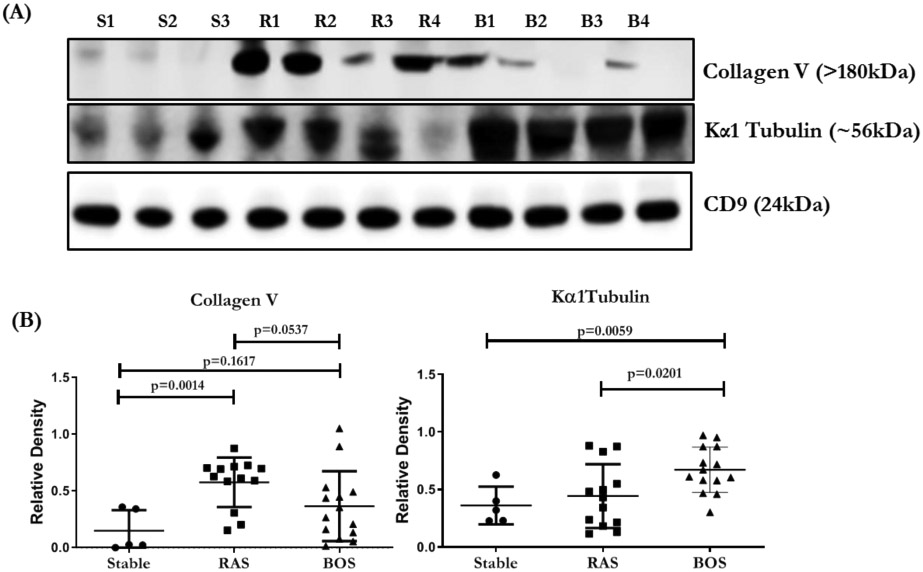
Figure 3:

(A) Western blot of exosomal proteins, lung SAgs (Col-V, Kα1T), from LTxRs with stable LTxRs (S1-S3), or RAS (R1-R4) and BOS (B1-B4). (B) Densitometry and statistical analysis of western blots for stable n=5, RAS n=13 and BOS n=14. CD9 given in the figure is used to normalize the blots for Col-V and Kα1 Tubulin. All the graphs are represented as dot plots with Mean (Longest horizontal line) and SD (Vertical Bar Line).*p<0.05, **p<0.01 and ***p<0.001. BOS, bronchiolitis obliterans syndrome; RAS, restrictive allograft syndrome.
