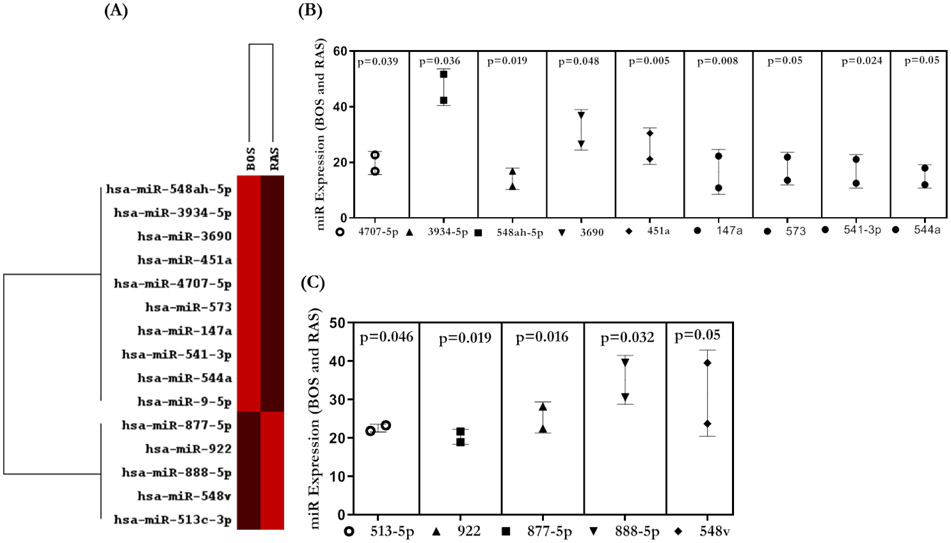
Figure 5:
(A) Heat map for miRNA profiling from RAS and BOS exosomes. (B) Nested plot for miRNAs higher in BOS samples. (C) Plot for miRNAs present in higher amounts in RAS samples. Only significantly differentially expressed miRNAs are shown. All the graphs represented as Nested Plots with Mean and SD (Vertical Bar Line). *p<0.05, **p<0.01 and ***p<0.001. *p<0.05, **p<0.01 and ***p<0.001. BOS, bronchiolitis obliterans syndrome; miRNA, micro RNA; RAS, restrictive allograft syndrome.

