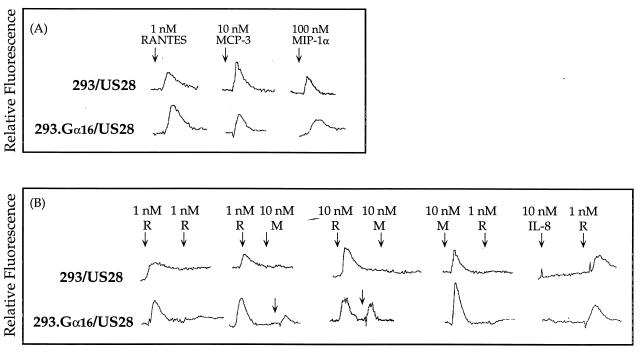
FIG. 6.
Tracings of intracellular Ca2+ flux in cells expressing US28 after stimulation with chemokines. Each tracing is representative of three separate runs. (A) Single stimulation of 293 and 293.Gα16 cells expressing US28 with RANTES, MCP-3, and MIP-1α. (B) Sequential stimulation of 293 and 293.Gα16 cells expressing US28 with either 1 or 10 nM RANTES (R) or 10 nM MCP-3 (M).

