
Figure 4.
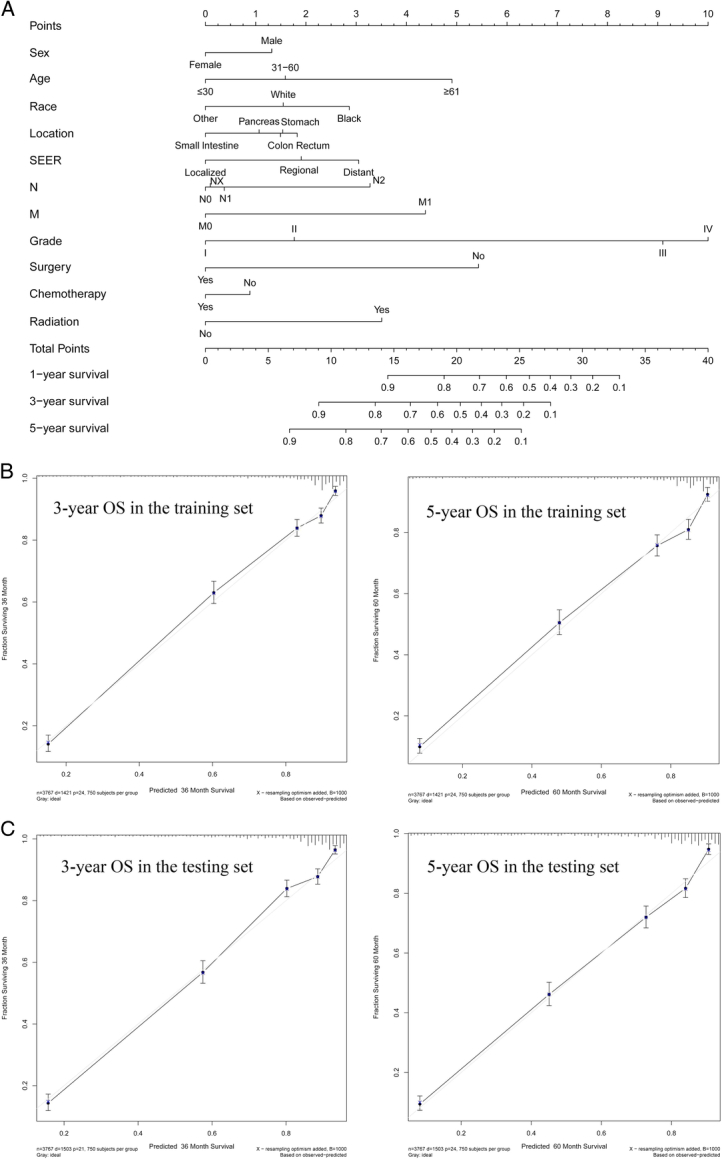
Nomogram and the calibration curves. (A) Nomogram for predicting 3-year and 5-year overall survival for gastroenteropancreatic neuroendocrine tumours; (B) The calibration curves of overall survival nomograms in the training set; (C) The calibration curves of overall survival nomograms in the testing set. OS, overall survival; SEER, Surveillance, Epidemiology, and End Result.