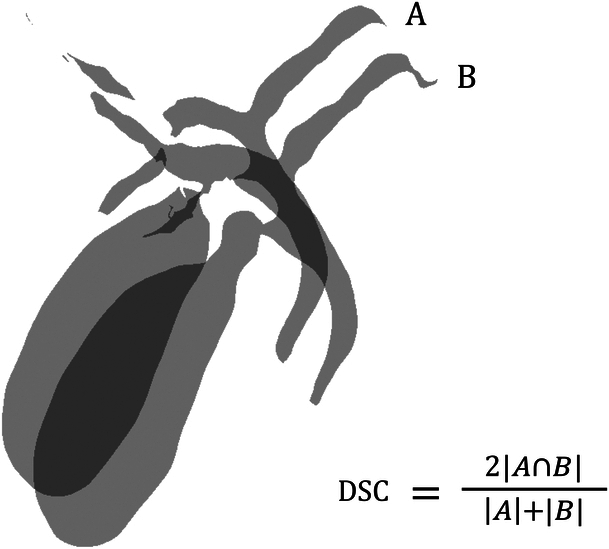
Figure 2.

Illustration of Dice similarity coefficient (DSC) for biliary structure segmentation. The shaded areas represent the segmented regions from two different methods: A (e.g. manual segmentation) and B (e.g. automated segmentation by the deep learning model). The intersection of A and B represents the common area correctly identified by both methods. The DSC is calculated by the formula shown, which quantifies the similarity between the two segmentation results. The closer the DSC value is to 1, the higher the degree of agreement between the two methods.
