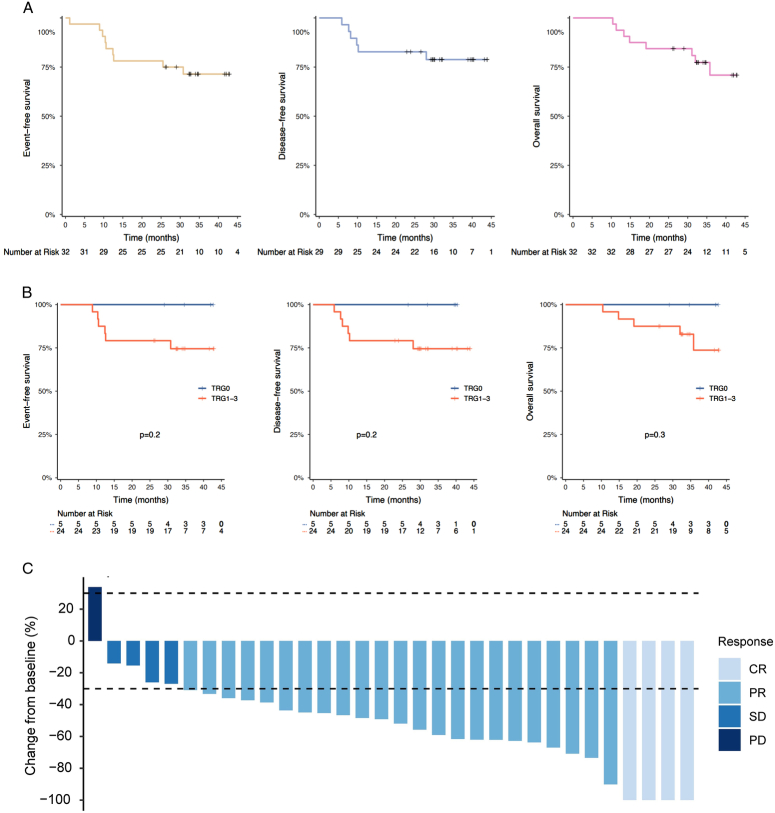
Figure 4.
Survival outcomes and tumour radiological response. (A) Kaplan–Meier curves for event-free survival and overall survival in the FAS population (n=32), and disease-free survival in the surgery set (n=29). (B) Kaplan–Meier curves for event-free survival, overall survival and disease-free survival in the surgery set (n=29) under the stratification factor of TRG status. (C) Waterfall plot of tumour size change from baseline to maximum percentage in FAS as per RECIST version 1.1 (n=32). CR, complete response; FAS, full analysis set; PD, progressive disease; PR, partial response; RECIST, response evaluation criteria in solid tumours; SD, stable disease; TRG, tumour regression grading.

