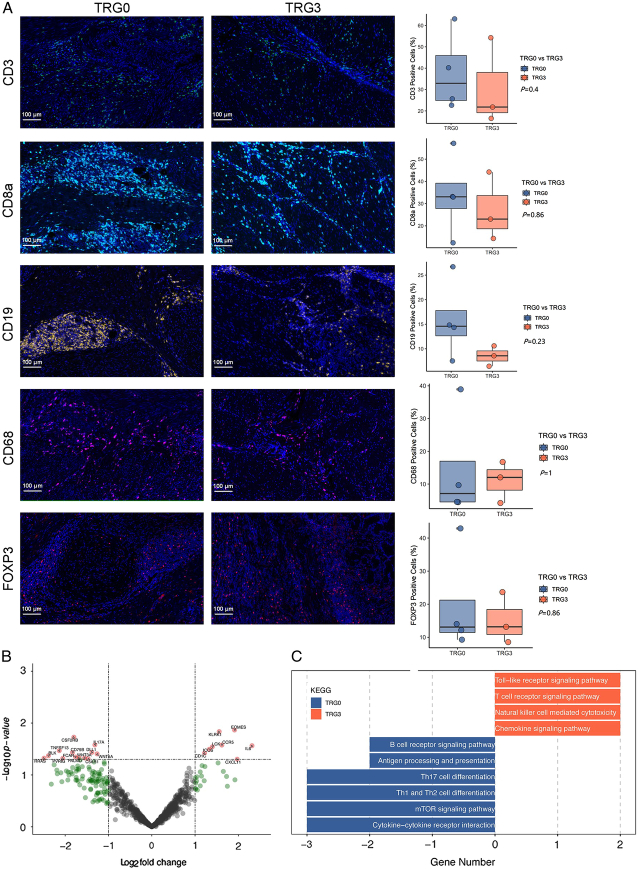
Figure 6.
Dynamic complexity and diverse behaviour of tumour microenvironment in patients with different pathological responses. (A) Immune cell infiltration in tumour parenchyma by multiple immunofluorescence staining. Densities of the following cells are compared between patients with TRG0 (n=5) and TRG3 (n=3): infiltrating CD3+ cells, infiltrating CD8+ cells, infiltrating CD19+ cells, infiltrating CD68+ cells, infiltrating FOXP3 cells. (B) Volcano plot displaying significantly differentially expressed immune-related genes between TRG0 and TRG3 groups. (C) Immune pathways with a significantly different expression between TRG0 and TRG3 groups per gene set enrichment analysis. TRG, tumour regression grading.

