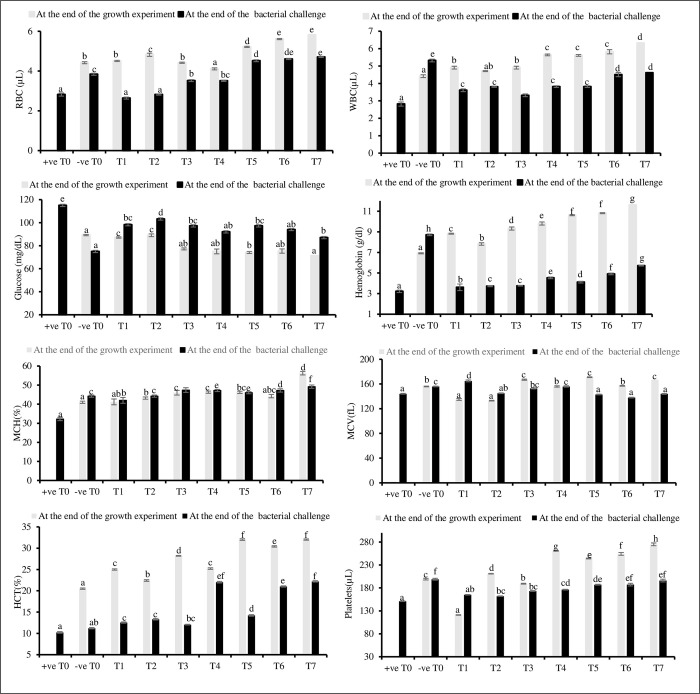
Fig 1. Analysis of hematological parameters in eight treatments at the end of the growth experiment and after bacterial challenge.
Different superscripts represent the variance between treatments were calculated by Duncan multirange test of one-way ANOVA at P < 0.05. different treatments are as follows: T0; control, T1; Tryptophan, T2; Lysine; T3; Methionine: T4; Tryptophan + Methionine, T5; Lysine +Tryptophan, T6; Methionine +Lysine, T7; Lysine + Tryptophan +Methionine. Hemoglobin (Hb), white blood cells (WBC), red blood cells (RBC), mean corpuscle volume (MCV), haematocrit (HCT), mean corpuscular hemoglobin (MCH), μL–microliter, fL- femtoliter.

