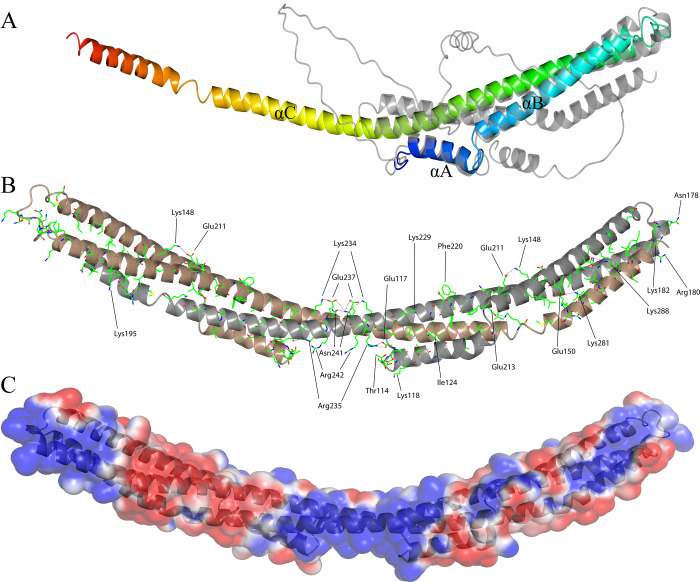
Fig 1.
(A) The overall crystal structure of B. burgdorferi FtlA (blue at the N-terminus gradually switching to red at the C-terminus) superimposed with the predicted structure of FtlA (gray; Cα root-mean-square deviation 1.14 Ǻ). All three α-helices in the crystal structure have been designated αA to αC. (B) FtlA homodimer as observed in the crystal structure. In the homodimer, one FtlA molecule is illustrated in gray, while the second is shown in brown. The residues found to be conserved between the PFam12 members FtlA, FtlB, FtlC, FtlD, and FtlE are indicated. Ionic interactions between the side chains are shown as dotted lines. (C) Electrostatic surface potential of B. burgdorferi FtlA. The electrostatic potentials (red, negative; blue, positive) were calculated using APBS [39]. The surface contour levels were set to -1 kT/e (red) and +1 kT/e (blue).

