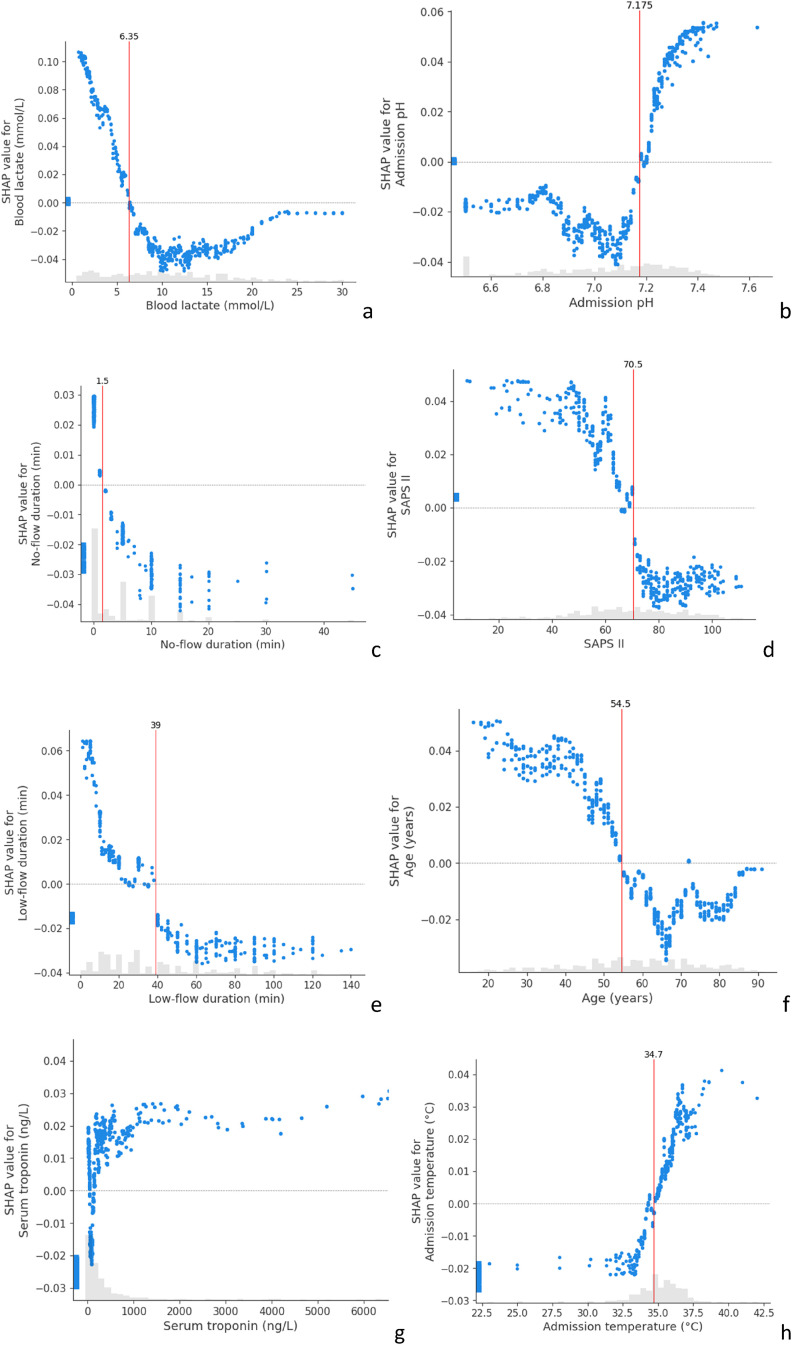
Figure 4.
SHAP dependence contribution plots, illustrating the link between individual feature values and SHAP values for the prediction of a good neurological outcome. For each feature, we identified the thresholds which differentiate between positive and negative SHAP values (vertical red lines). The grey histograms represent the distribution of patients for each feature value.
(a) SHAP value for blood lactate; (b) for admission pH; (c) no-flow duration (min); (d) for SAPS II; (e) for low-flow duration (min); (f) for Age (years); (g) for admission serum troponine; (h) for admission temperature.
SHAP: SHapeley Additive exPlanations; SAPS II: Simplified Acute Physiology Score II.

