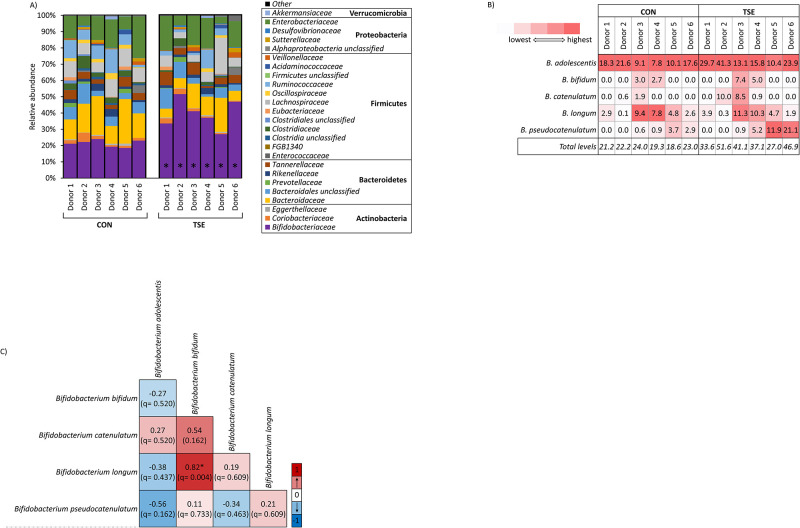
Fig 3. Phylogenetic composition in the control and tomato seed groups.
A) Taxa identified at the family level present at a > 1% relative abundance. Statistical significance between groups is indicated with an * asterisk symbol. B) Table showing percentage of Bifidobacterium identified for each donor in the control and tomato seed groups. C) Spearman’s correlation performed on communities across the control and tomato seed groups. Statistical significance is indicated in the figure with an * symbol. CON = control; TSE = tomato seed extract.

