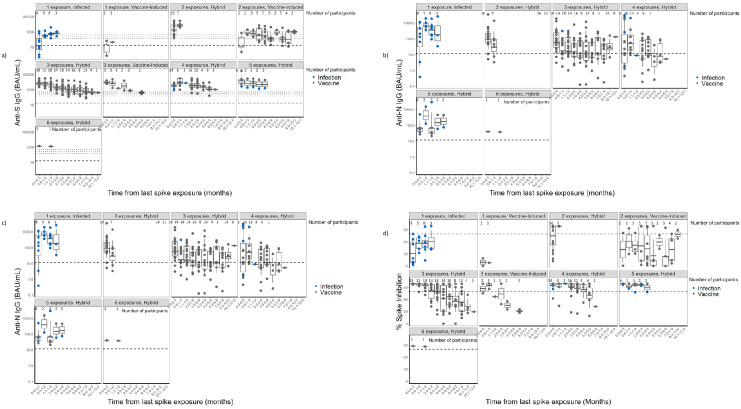
Fig 2. Distribution of IgG antibodies to SARS-CoV-2 spike (full-length spike, S, and S1 subunit receptor binding domain, RBD) and nucleocapsid (N) in nursing home residents—Georgia, December 2020–July 2022 (n = 37).
A: Distribution of anti-SARS-CoV-2 spike (S) IgG antibodies. Footnotes: N: number of participants at each time point; anti-S IgG: anti-SARS-CoV-2 Spike IgG; BAU/mL: Binding antibody units/mL. Y-axis: Antibody levels in BAU/mL in logarithmic scale. This graph shows the geometric mean titers of measured anti-S IgG antibodies. Blue dots (SARS-CoV-2 infection) and black dots (mRNA COVID-19 vaccine) represent the last exposure type. Seropositivity thresholds were defined by the manufacturer and listed in the kit insert as follows: anti-S IgG 17.66 BAU/mL, as indicated by the lower dashed line. Calibration of the SARS-CoV-2 antibody assays to the 1st WHO international standard for anti-SARS-CoV-2 IgG allowed for visual assessment of antibody concentrations in our evaluation to those associated with a computed average overall protective threshold of 154 BAU/mL for wild type, 95% Pfizer BNT162b2 VE against COVID-19 (for two doses against wild type 530 anti-S IgG BAU/mL; Goldblatt, 2022) and 90% Moderna mRNA-1273 VE against COVID-19 (for two doses against wild type, 298 anti-S IgG BAU/mL and 775 anti-RBD IgG BAU/mL; Gilbert 2022)—as indicated by the three upper dotted lines. B: Distribution of anti-SARS-CoV-2 Receptor Binding Domain (RBD) IgG antibodies. Footnotes: N: number of participants at each time point; anti-RBD IgG: anti-SARS-CoV-2 Receptor-Binding Domain IgG; BAU/mL: Binding antibody units/mL. Y-axis: Antibody levels in BAU/mL in logarithmic scale. This graph shows the geometric mean titers of measured anti-RBD IgG antibodies. The last exposure type is represented by a blue dot (SARS-CoV-2 infection) and a black dot (mRNA COVID-19 vaccine). Seropositivity thresholds were defined by the manufacturer and listed in the kit insert as follows: anti-RBD IgG 14.64 BAU/mL as indicated by the lower dashed line. Calibration of the SARS-CoV-2 antibody assays to the WHO 1st international standard for anti-SARS-CoV-2 immunoglobulin allowed visual assessment of antibody concentrations in our evaluation to those associated with 90% Moderna mRNA-1273 VE against COVID-19 (775 anti-RBD IgG BAU/mL—as indicated by the upper dotted line; Gilbert, 2022). C: Distribution of anti-SARS-CoV-2 Nucleocapsid (N) IgG antibodies among those with hybrid immunity. Footnotes: anti-N IgG: anti-SARS-CoV-2 Nucleocapsid IgG; BAU/mL: Binding antibody units/mL. Y-axis: Antibody levels in BAU/mL in logarithmic scale. This graph shows the geometric mean titers of measured anti-N IgG antibodies. The last exposure type is represented by a blue dot (SARS-CoV-2 infection) and a black dot (mRNA COVID-19 vaccine). Seropositivity thresholds were defined by the manufacturer and listed in the kit insert as follows: anti-N IgG 11.80 BAU/mL, as indicated by the dashed line. Although the vaccine exposure has been included as part of the spike exposures, the anti-N IgG is only affected by a SARS-CoV-2 infection. D: Virus Neutralizing Capacity using percent spike inhibition. Footnotes: Y-axis: Percent spike inhibition. This graph shows the percent spike inhibition (virus neutralizing capacity). The last exposure type is represented by a blue dot (SARS-CoV-2 infection) and a black dot (mRNA COVID-19 vaccine). The functional antibody response threshold was set at 80% inhibition, as indicated by the dashed line.

