. 2023 Dec 27;55(2):495–509. doi: 10.1044/2023_LSHSS-23-00071

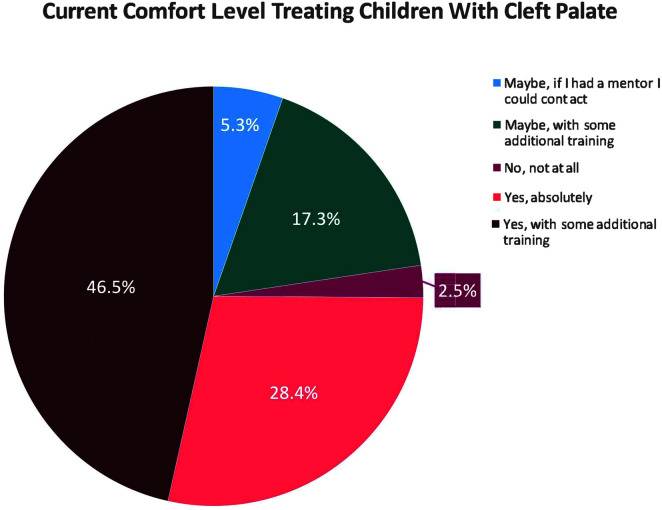
Figure 3.

A pie chart. The title of the pie chart is Current Comfort Level Treating Children With Cleft Palate. The data are as follows. Blue: 5.3 percent. Green: 17.3 percent. Red: 2.5 percent. Pink: 28.4 percent. Brown: 46.5 percent. The legend is as follows. Blue: Maybe, if I had a mentor I could contact. Green: Maybe, with some additional training. Red: No, not at all. Pink: Yes, absolutely. Brown: Yes, with some additional training.

Percentage of respondents who are comfortable with treating children with cleft palate, who are not comfortable treating children with cleft palate, or with what support they would need to feel comfortable.