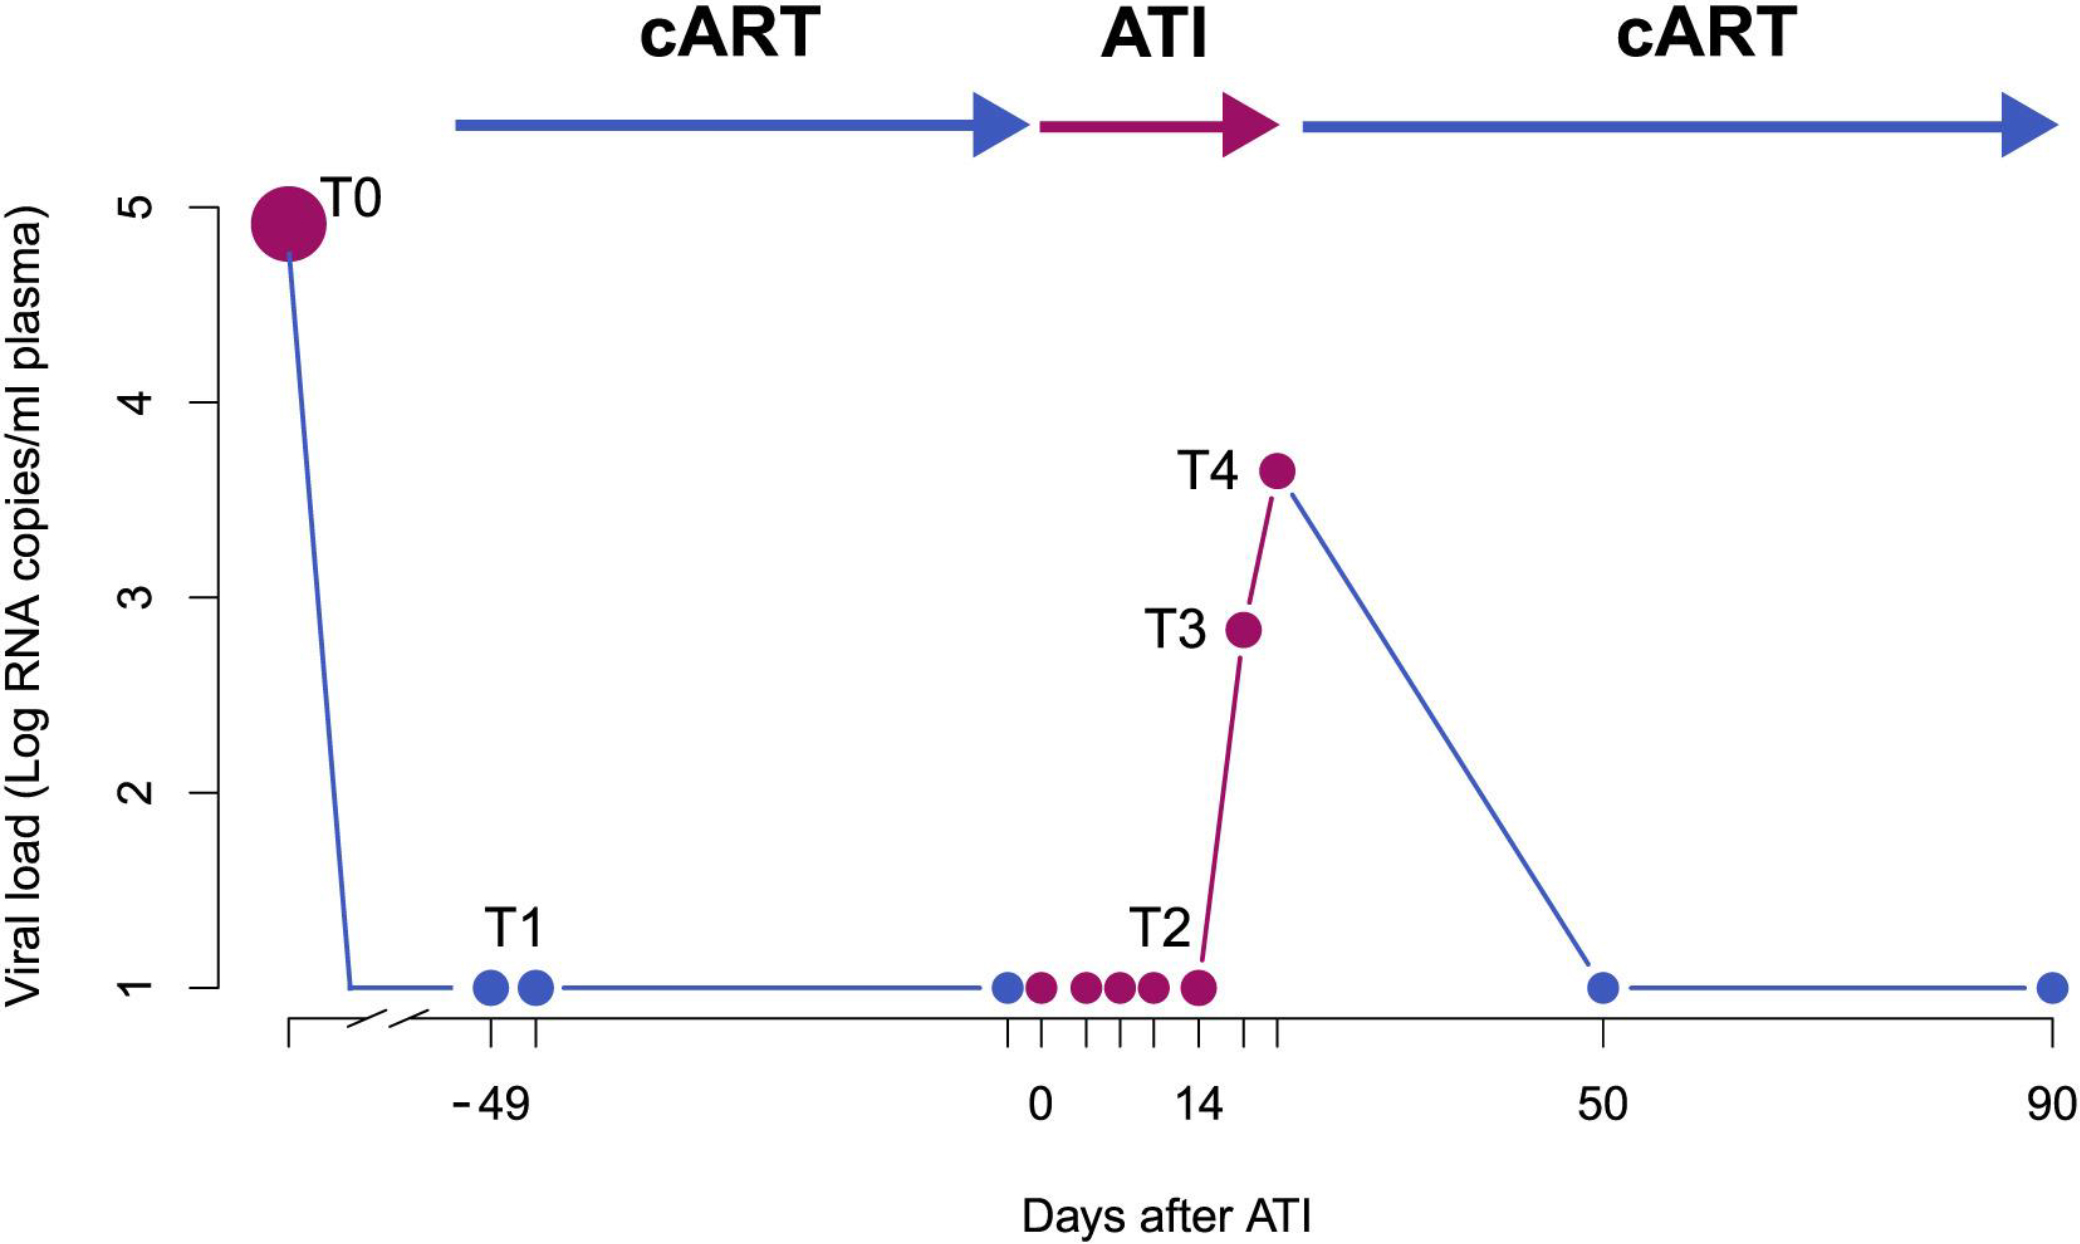
Figure 1. In-Depth HIV Sampling before and during ATI.

T1 represents the sampling under cART, including tissue sampling and leukapheresis within the same week; upon ATI (day 0 on the x axis), blood samples were taken every 2–3 days. T2 represents the time point of leukapheresis after ATI (8–15 days after day 0); T3 represents the first detectable viral load (>30 copies/mL) and T4 is defined as the time of viral rebound (>1,000 copies/mL or at second measurement of >200 copies/mL). Treatment was re-initiated immediately after the sampling at T4 and participants were intensively monitored until undetectable viral load in plasma was achieved (<20 copies/mL). T0 represents the time of plasma sampling prior to initial treatment initiation. The dots represent the sampling points on cART (blue), off cART (pink).
