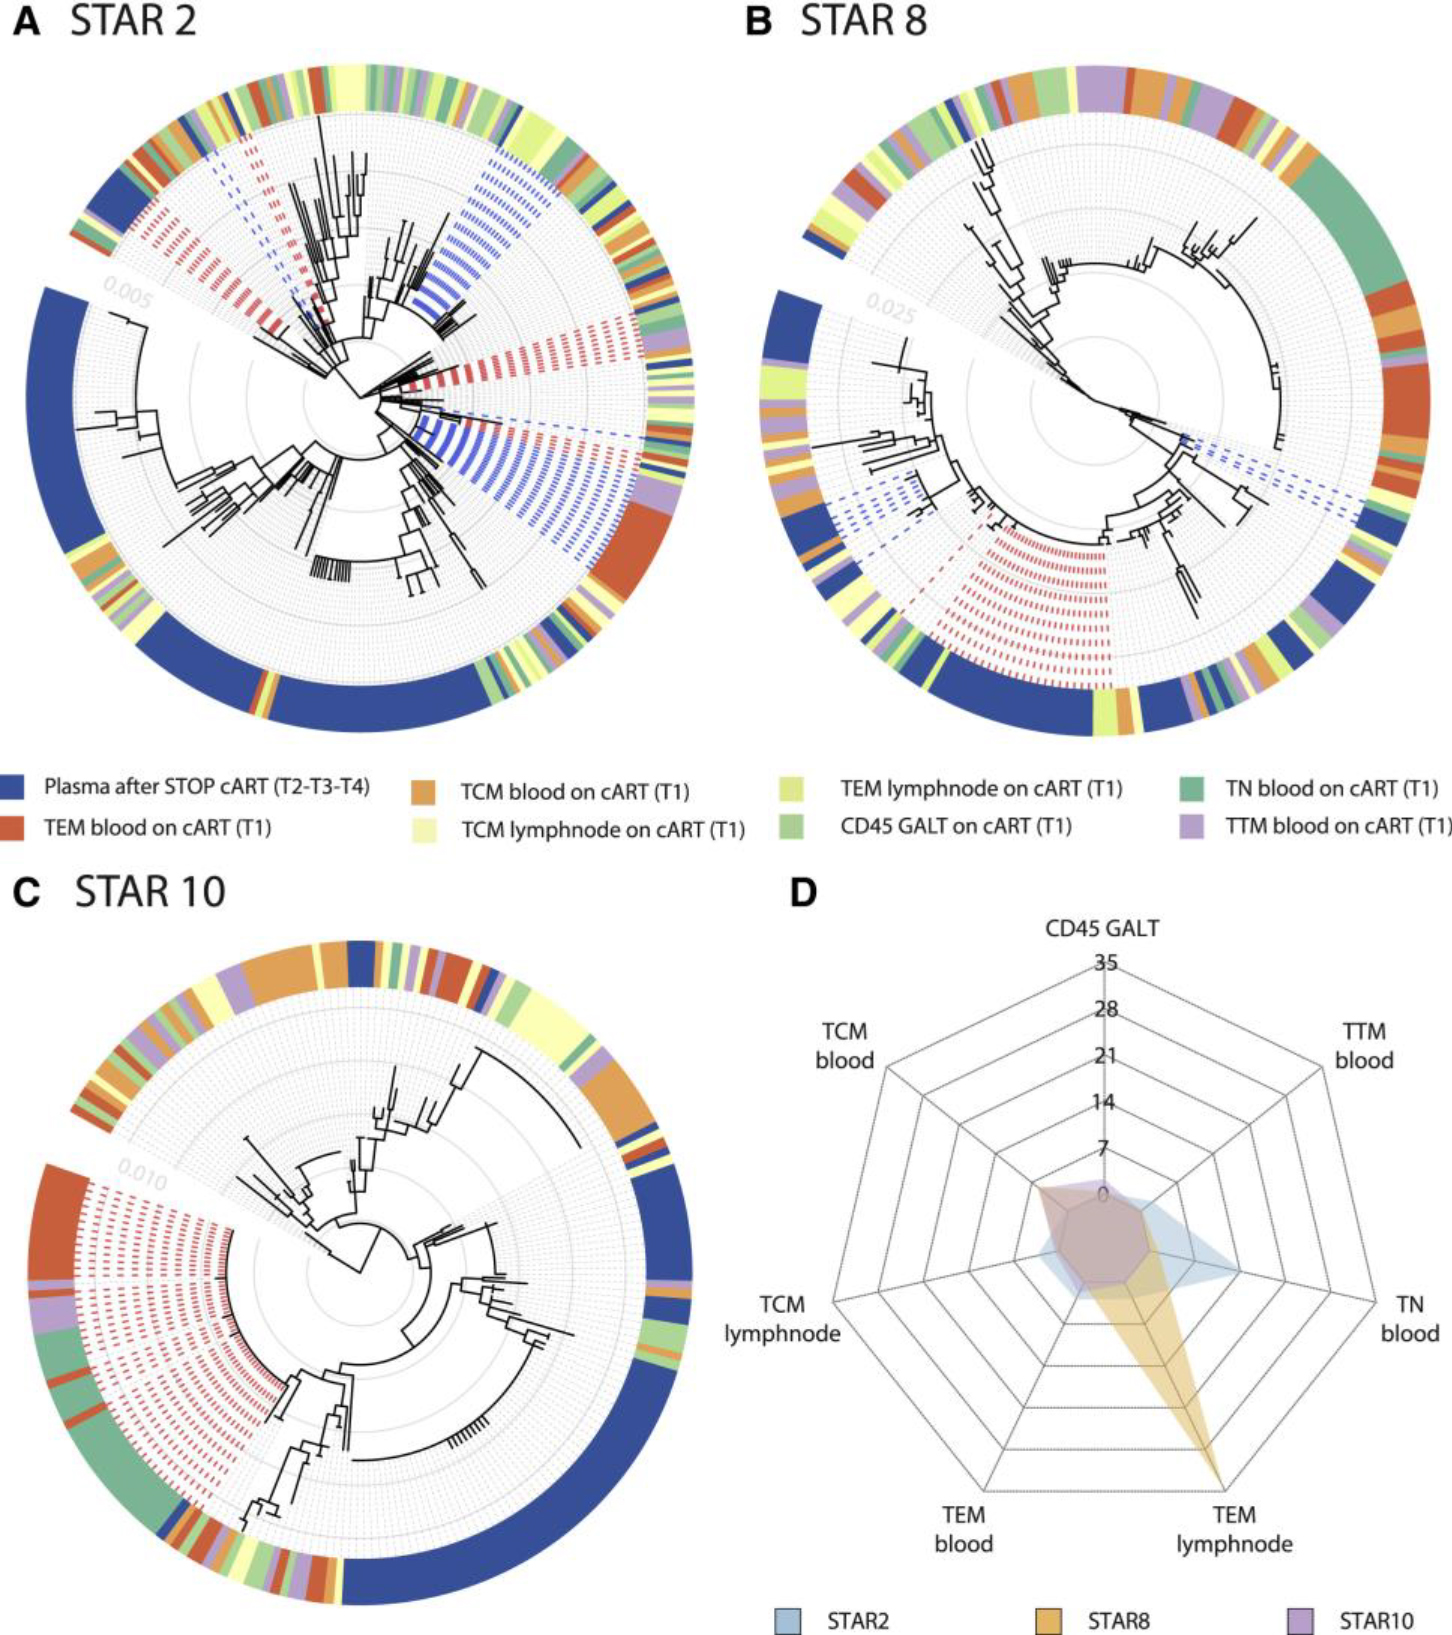
Figure 3. Heterogeneous Cellular and Anatomical Reservoir Contributions to HIV Rebound with Cellular Proliferation as a Potential Driver.

Within-host ancestor-descendant relationships between the viruses from different cell types for 3 participants and a radar plot representing the variability in viral rebound source.
(A–C) Maximum likelihood phylogenetic trees from three selected participants representing the sequences from T1 cell subsets from blood (TCM, TEM, TTM, and TN), LN (TCM and TEM), and GALT (CD45+ cells) before ATI. Plasma viruses from time points T2, T3, and T4 are grouped as plasma after STOP cART. The colored strip represents sampling origin for each sequence as indicated by the legend. The trees are drawn to scale and the gray circles represent the branch length from the root expressed as the number of substitutions per site. The scale values are given in the inset (light gray numbers). The heterogeneity in potential reservoir contribution is indicated by the color mixing in the strip. Identical cellular DNA V1–V3 sequence expansions that are identical to plasma RNA sequences after cART STOP were highlighted in the trees by the bold dashed lines, with the expansions colored in red and blue alternatingly. Trees from all participants are provided in Figure S1.
(D) The radar plot representing, for each of the 3 participants, the estimated number of times that a rebound virus lineage originates from the respective cell subsets (depicted as the numbers from 0 to 35). The legend indicates the color used for each participant. A radar plot across all participants is available in Figure S4.
