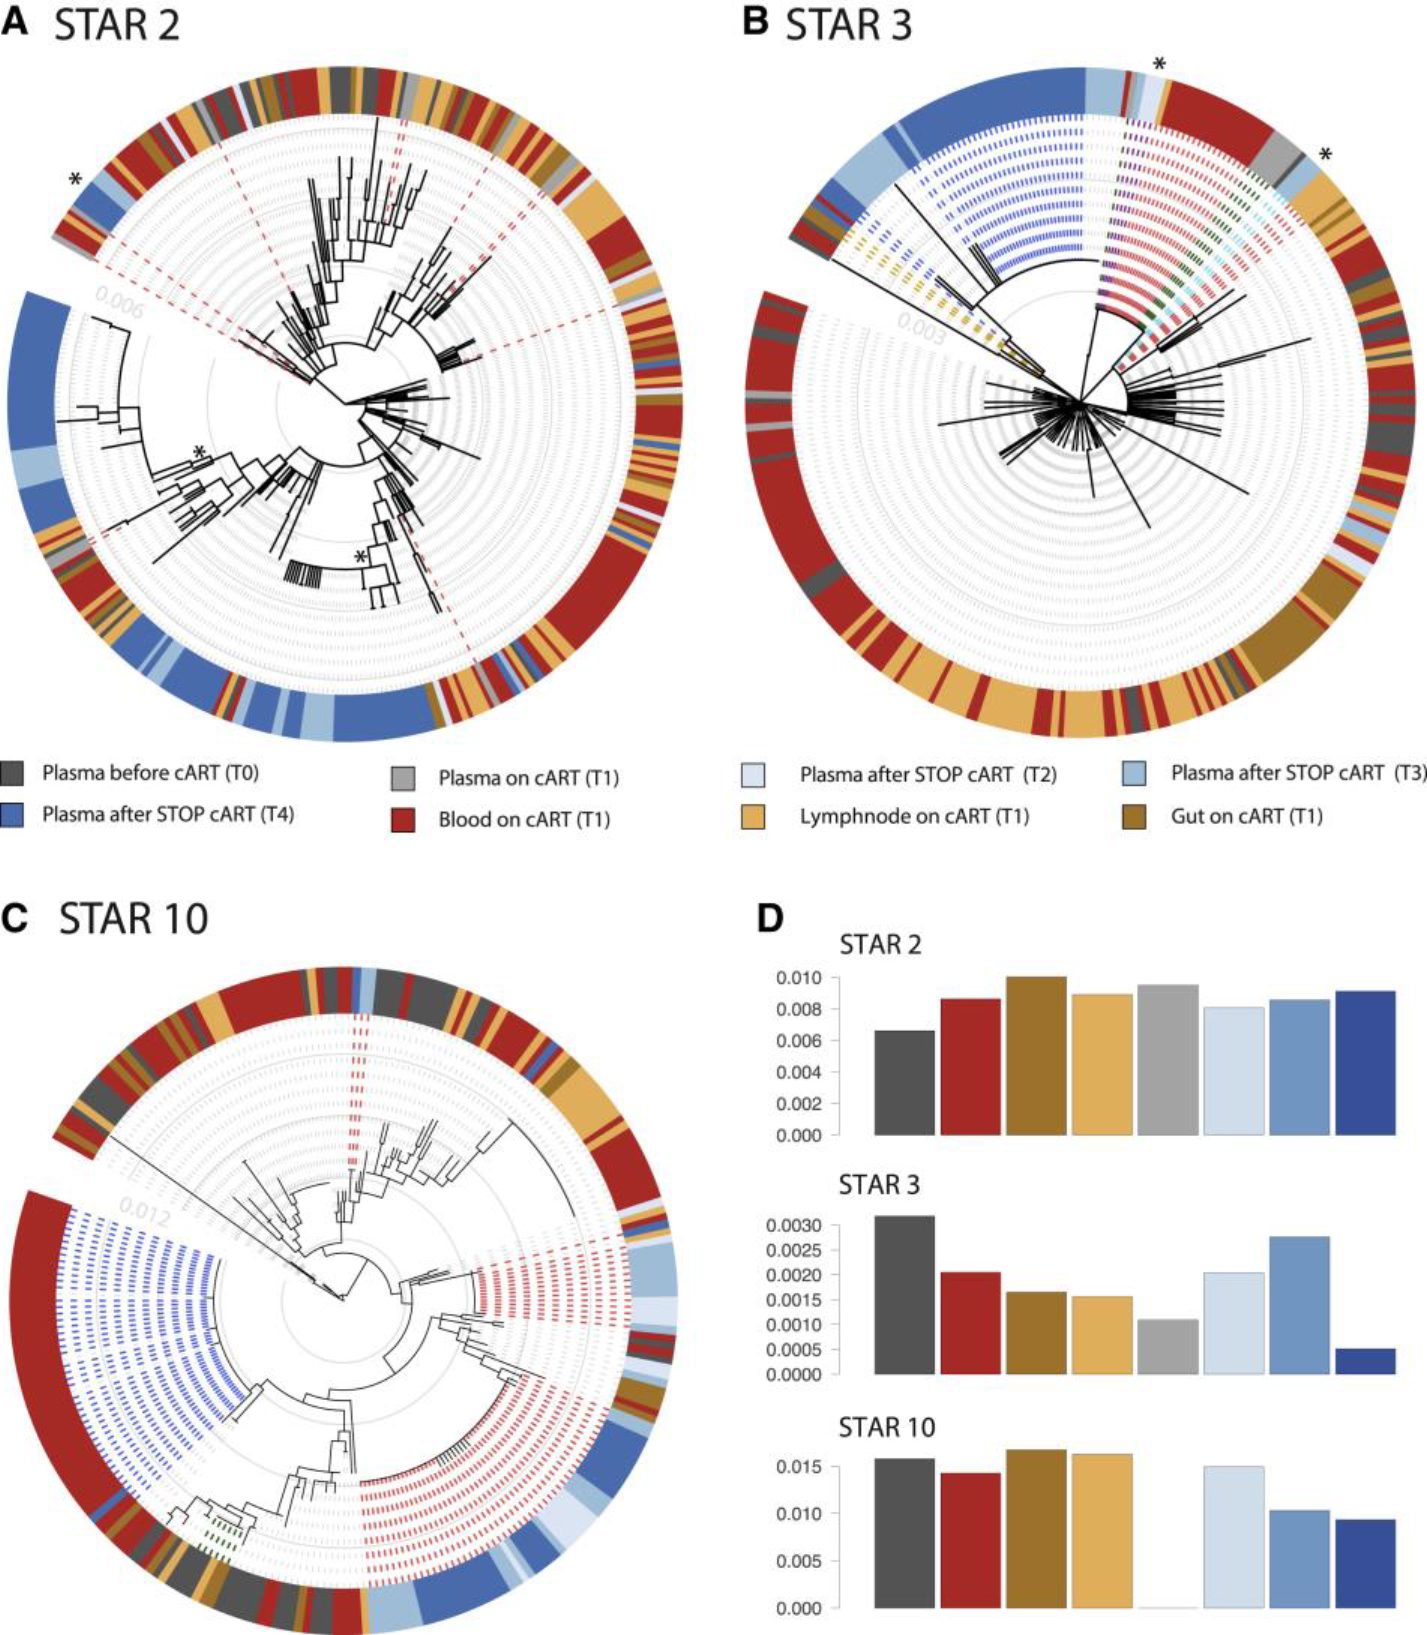
Figure 5. Evidence for Kinetic Variability and Stochastic Reactivation of Rebound Viruses after Treatment Interruption.

(A–D) Within-host ancestor-descendant relationships between the viruses from different anatomical compartments and the RNA plasma sequences collected at different time points for 3 participants and nucleotide diversity estimates. Shown are maximum likelihood phylogenetic trees highlighting the sequences obtained from plasma RNA at the different time points of sequencing T0, T1, T2, T3, and T4. (A) represents STAR 2 where the red dashed lines represent the many different plasma virus lineages detected at T1, consisting of mostly unique sequences. (B) represents STAR 3 with the green dashed lines representing identical plasma virus expansions at T1 that are identical to plasma viruses collected at later time points T2 and T3 (indicated in purple). The red dashed lines represent proviruses from the reservoir that are identical to sequences found in the plasma at T2 and T3 (indicated in purple and light blue). The blue dashed lines represent T4 rebound viruses, for which the link with the proviral reservoir is less likely in this participant than at T2 and T3. The orange dashed lines show a single rebound virus collected at T4 that is identical to a provirus from GALT. (C) represents STAR 10 where the red dashed lines represent the typical clustering of rebound viruses at T2, T3, and T4 as observed for most participants. The blue dashed lines represent a T4 rebound sequence with identical proviruses from several cell subsets but not observed earlier in the plasma at T2/T3. The green dashed line shows how expansions of virus at T0 persist over time in the reservoir. The total number of rebound events is approximated by the number of “blue blocks” (i.e., closely related rebound viruses) in the colored circle surrounding to the phylogenies, as these usually correspond to a single rebound event from the reservoir. However, when identical rebound viruses are also identical to a reservoir virus, that particular reservoir origin will be the most likely inferred state at the parental node of the terminal branches leading to these identical rebound sequences. We mark such lineages that are estimated to have arisen through multiple rebound events with an asterisk. Trees from all participants are provided in Figure S1B. (D) represents for these participants various levels of nucleotide diversity (y axis) in the different compartments and plasma time points (x axis). Nucleotide diversity for all particants is available in Figure S3.
