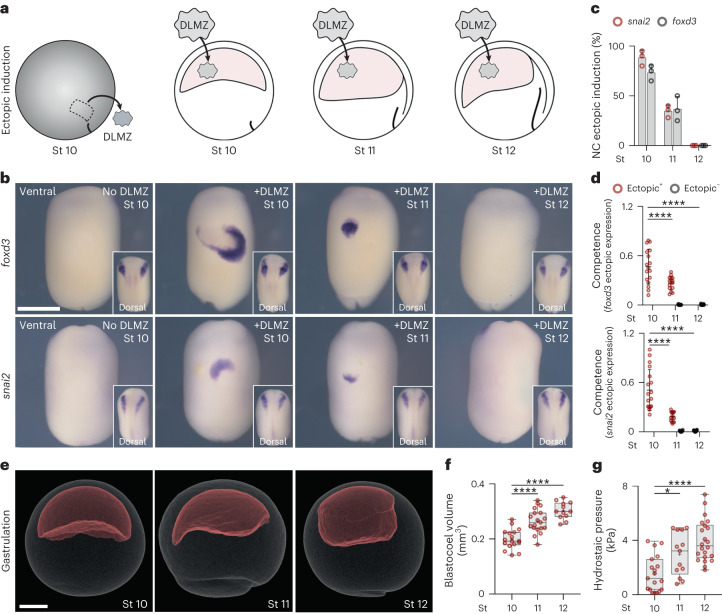
Fig. 1. Loss of neural crest competence correlates with increased hydrostatic pressure.
a, Schematic of neural crest ectopic induction assay using DLMZ as the inducer (grey), grafted into host blastocoel cavity (red). b, In situ hybridization analysis of foxd3 and snai2 at stage (St) 17 and 18, respectively, seen in ventral view and dorsal view as inset. c, Spread of data indicating the percentage of embryos with ectopic induction analysed with different neural crest (NC) markers. d, Quantification of neural crest competence at the indicated stages; 10, 11 and 12 normalized to control with no graft. Embryos that exhibited ectopic induction are represented as Ectopic+ (red), and embryos with no ectopic induction are shown as Ectopic− (black). e, Micro-CT of a whole mount embryo (grey) at stages 10, 11 and 12 showing blastocoel cavity (red). f,g, Quantification of blastocoel volume (f) and hydrostatic pressure (g) at stages 10–12. Scale bars, 450 µm for ventral and 200 µm for dorsal (b) and 300 µm (e). Statistical analysis was performed using two-sided Dunnett’s tests (*P = 0.0164 (g), ****P ≤ 0.0001 (d,f), 95% CI). Data are mean and s.d. (c). Box plots (f,g) show median, 25th and 75th percentiles, and whiskers extending to minimum and maximum values. Three independent experiments (c,d). n = 17st10, 19st11 and 12st12 embryos (f) and n = 19st10, 13st11, and 22st12 embryos (g).

