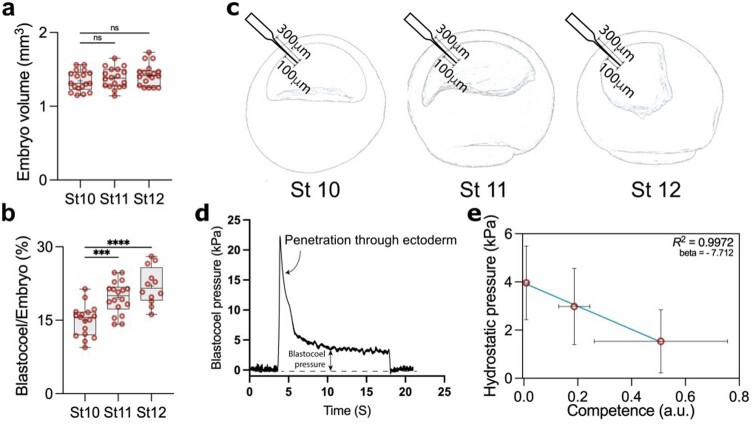
Extended Data Fig. 2. Changes in blastocoel volume and hydrostatic pressure.
a, Quantification of embryo volume at stage 10 (n = 18 embryos), 11 (n = 18 embryos), and 12 (n = 18 embryos). b, Percentage of the ratio of blastocoel volume to whole embryo volume at stage 10 (n = 17), 11 (n = 18), and 12 (n = 12). c, Schematic of embryos at different stages showing microelectrode penetration (0.5-1 µm tip) through ectoderm. d, Profile of a successful measurement of blastocoel hydrostatic pressure. Pressure is close to zero whilst the microelectrode is not in contact with the embryo before and after measurement. A transitory spike is noted during penetration of the microelectrode through the ectoderm. The spike is followed by a stable phase between five to ten seconds, indicating the actual blastocoel pressure. e, Correlation between Hydrostatic Pressure and Competence. ‘R2 = 0.99 and beta = −7.7, as calculated using orthogonal distance regression (ODR) to account for measurement variability in estimating neural crest competence and the hydrostatic pressure within the blastocoel cavity. Statistical analysis was performed using two-sided Dunnett’s test (NS, P > 0.1639; a, ***P = 0.0003; b, ****P ≤ 0.0001; b, CI = 95%). Box plots (a and b) show median, 25th and 75th percentiles, and whiskers extend to minimum and maximum values. Data represent mean, error bars are s.d. (e). Three independent experiments (e).

