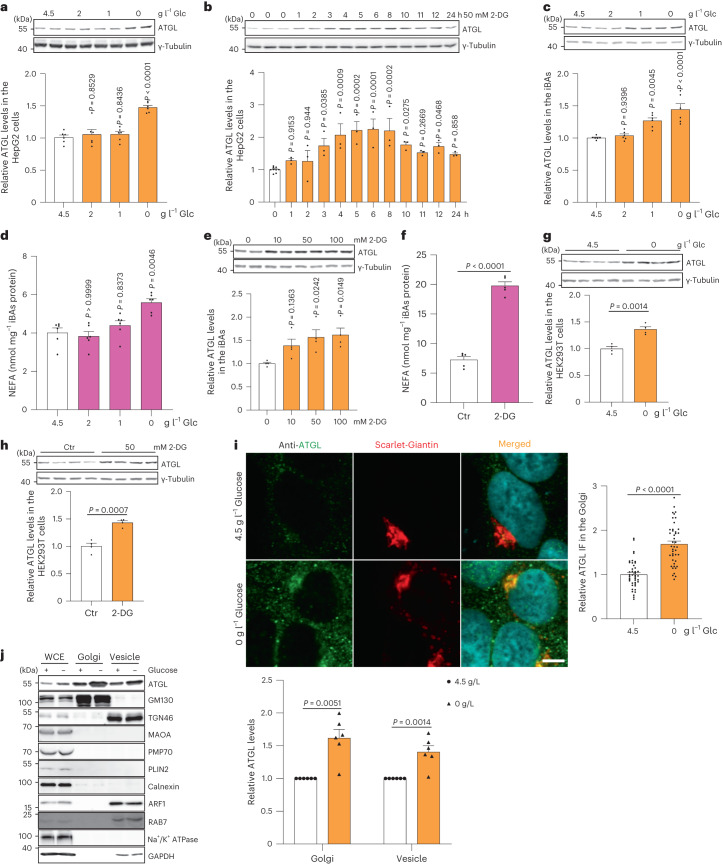
Fig. 2. Glucose deprivation modulates lipolysis via stabilizing ATGL in the Golgi.
a, Immunoblot of ATGL in HepG2 cells cultured at different glucose (Glc) concentrations for 6 h (n = 6 independent experiments per group). b, Immunoblot of ATGL in HepG2 cells treated with 50 mM 2-DG and collected at indicated timepoints (n = 9 or 3 independent experiments for control or 2-DG groups). c, Immunoblot of ATGL in iBAs cultured at different glucose concentrations for 24 h (n = 6 independent experiments per group). d, Levels of NEFAs in the starvation medium released by iBAs in the basal state 24 h after treatment with medium at different glucose concentrations (n = 6 independent experiments per group). e, Immunoblot of ATGL in iBAs treated with 2-DG at indicated concentrations for 24 h (n = 4 independent experiments per group). f, Levels of NEFAs in the starvation medium released by iBAs in the basal state 24 h after treatment with control vehicle (Ctr) and 100 mM 2-DG (n = 5 independent experiments per group). g, Immunoblot of ATGL in HEK293T cells 6 h after glucose withdrawal (n = 4 independent experiments per group). h, Immunoblot of ATGL in HEK293T cells 12 h after treatment with Ctr and 50 mM 2-DG (n = 4 independent experiments per group). i, Immunofluorescence of ATGL in HEK293-AAV cells 6 h after treatment with glucose free medium (n = 43 cells per group). Scale bar, 5 μm. j, Immunoblot of ATGL in the WCE, Golgi and vesicle fractions extracted from HEK293T cells 6 h after glucose withdrawal (n = 6 independent experiments per group). Results are shown as mean ± s.e.m. and analysed using two-tailed unpaired t-test (f–i), two-tailed paired t-test (j), one-way ANOVA method with Dunnett correction for multiple comparisons between control and other groups (a–c and e) and Kruskal–Wallis test with Dunn’s correction for multiple comparisons between control and other groups (d). Source numerical data and unprocessed blots are available in .

