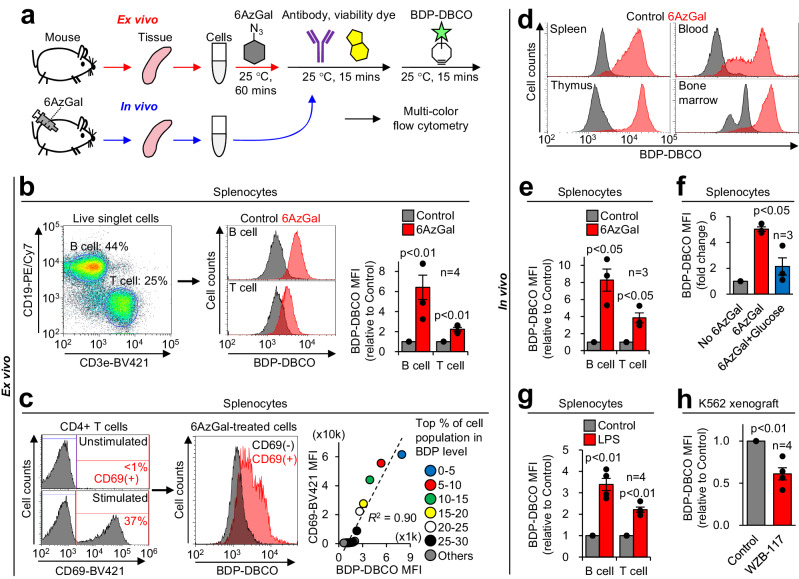
Fig. 4. Measurement of 6AzGal uptake ex vivo and in vivo.
a Workflow for multicolor phenotyping of cells receiving 6AzGal ex vivo and in vivo. For ex vivo experiments, cells isolated from tissues were incubated with 6AzGal, stained with antibodies and a viability dye, labeled with BDP-DBCO, and analyzed by flow cytometry. For in vivo experiments, 6AzGal was injected into mice, followed by cell isolation, multiple labeling, and flow cytometric analysis. b Ex vivo 6AzGal uptake in splenocytes. Cells isolated from mouse spleens were treated with 6AzGal, labeled with anti-CD marker antibodies, FVD780, and BDP-DBCO, and analyzed by flow cytometry to quantify 6AzGal labeling in B and T cells (gating strategy shown in Fig. S4b). c Increased 6AzGal uptake in ex vivo-activated T cells. CD3/CD28-stimulated CD4+ T cells were analyzed by flow cytometry to quantify CD69 expression and 6AzGal labeling (gating strategy shown in Fig. S4f). Their correlation was evaluated by the order of BDP-DBCO MFI in subdivided populations (in right panel, one dot represents the MFI of 1 × 10³ cells). d In vivo 6AzGal uptake in mouse tissues. After 6AzGal injection into mice, cells isolated from the indicated tissues were labeled with BDP-DBCO and analyzed by flow cytometry (Fig. S5a). e In vivo 6AzGal uptake in splenocytes. Splenocytes isolated from 6AzGal-injected mice were subjected to flow cytometric quantification of 6AzGal labeling (Fig. S5d). f Competitive inhibition of in vivo 6AzGal uptake by D-glucose supplementation. Splenocytes isolated from mice cotreated with 6AzGal and D-glucose were subjected to flow cytometric quantification of 6AzGal labeling. g Increased 6AzGal uptake in inflammation models. After 6AzGal injection into LPS-treated mice, splenocytes were isolated and subjected to flow cytometric quantification of 6AzGal labeling (Fig. S6b). h Blocking 6AzGal uptake in tumors by the GLUT inhibitor. Nude mice with subcutaneous K562 xenografts were coinjected with 6AzGal and WZB-117, and subjected to flow cytometric quantification of 6AzGal labeling (Fig. S6e). Bar graphs represent means ± SEM. P values were determined by the t test.

