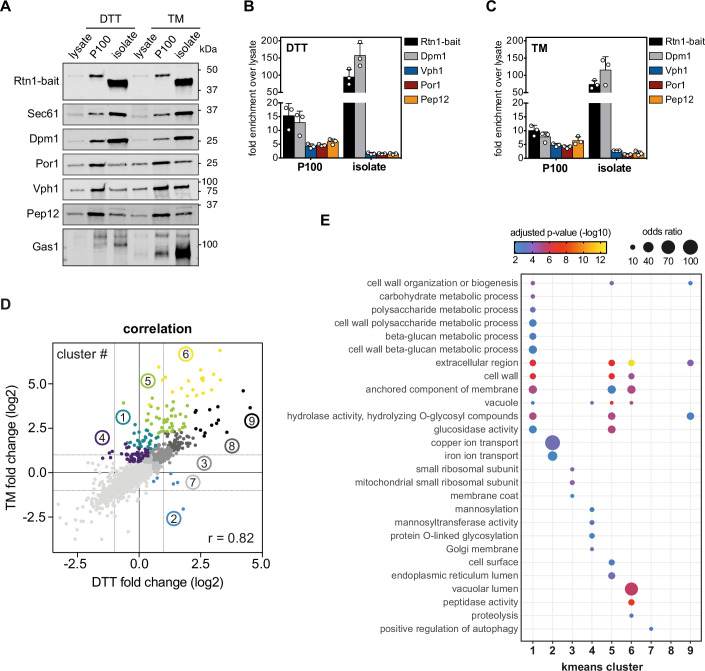
Figure EV5. Enrichment of stressed ER membranes by MemPrep.
(A) Immunoblot analysis of the indicated organellar markers in whole-cell lysates (lysate), crude membranes (P100), and MemPrep isolates (isolate). ER membranes were immuno-isolated via the Rtn1-bait protein. Sec61 and Dpm1 are prototypical ER membrane markers. Por1 is a marker for the outer mitochondrial membrane, Vph1 is a vacuolar marker. Pep12 marks endosomes and Gas1 serves as plasma membrane marker. 1 µg total protein loaded per lane. (B) Quantification of the organelle markers Dpm1, Vph1, Por1, Pep12 and the Rtn1-bait protein from three immunoblots of independent replicate ER MemPreps after prolonged proteotoxic stress induced by DTT (n = 3 biological replicates). (C) Quantification of three immunoblots from independent replicate ER MemPreps after prolonged proteotoxic stress induced by TM. Error bars indicate standard deviations (n = 3 biological replicates). (D) Correlation of DTT- and TM-induced fold changes, after Limma analysis, over pre-stress with a Pearson correlation coefficient r = 0.82. K-means clusters are indicated by colored groups and their respective cluster number (n = 3 biological replicates). (E) Gene ontology term enrichments in K-means clusters (n = 3 biological replicates). Data information: Data in (B, C), data from three biological replicates are presented as individual data points and as the mean ± SD. Data in (E) from n = 3 biological replicates are presented as the mean. P values were derived from a Fisher-test and corrected for multiple testing with the method of Benjamini and Hochberg. Source data are available online for this figure.

