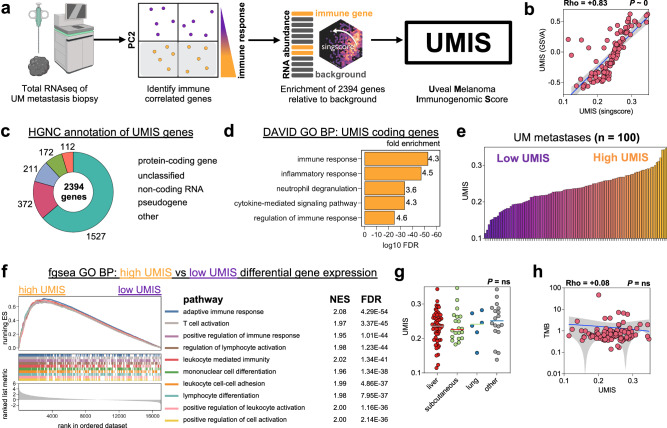
Fig. 3. Development of Uveal Melanoma Immunogenomic Score (UMIS).
a Workflow for the development of UMIS. Created with BioRender.com. b Correlation of UMIS scores calculated by the cohort-independent method, singscore, with UMIS scores calculated by the cohort-dependent method, gene set variation analysis (GSVA). c Annotation of UMIS genes using Human Genome Organization (HUGO) Gene Nomenclature Committee (HGNC). d Functional annotation of protein-coding genes within UMIS using Database for Annotation, Visualization and Integrated Discovery (DAVID) and Human Molecular Signatures Database Gene Ontology Biological Process gene set collection. e Distribution of UMIS scores across the cohort of 100 metastases. f Gene set enrichment analysis of differentially expressed genes between high UMIS and low UMIS UM metastases. The ten pathways with the lowest FDR are displayed. g Comparison of UMIS by source tissue of resected metastases (n = 100 biologically independent samples; liver = 56, subcutaneous = 20, lung = 6, other = 18). h Correlation of UMIS with TMB. Statistical comparisons were performed using Spearman’s rank correlation with overlaid simple linear regression to illustrate linearity (b, h), DAVID modified Fisher’s exact test (d), fast preranked gene set enrichment analysis (f), or Kruskal–Wallis test by ranks (g).

