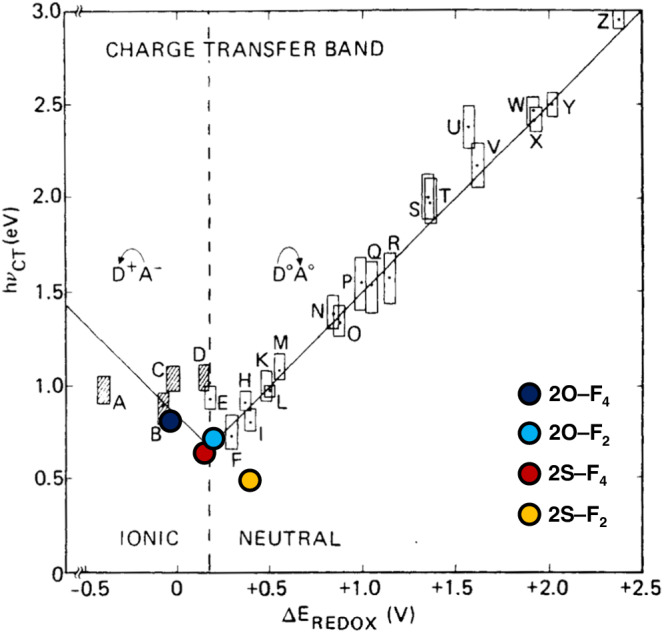
Fig. 2. Electronic and optical properties of mixed-stack complexes.

Relationship between ΔEREDOX and hνCT that has two separate linear correlations in the neutral and ionic regions; the two straight lines intersect when ΔEREDOX ≈ EM, resulting in the hνCT value reaches to the minimum (approximately 0.6 eV). The vertical dashed line indicates the neutral–ionic boundary (Reprinted and modified from Reference26, Copyright 1985, from Taylor & Francis). A: N,N,N’,N’-Tetramethyl-p-phenylenediamine (TMPD)–F4. B: DHMP–TCNQ. C: TMPD–TCNQ. D: TMPD–CA. E: N,N,N’,N’-Tetramethyl-1,6-pyrenediamine (TMDAP)–TCNQ. F: TTF–CA. G: TTF–p-fluoranil (FA). H: Dibenzene TTF–TCNQ. I: Diethyldimethyltetraselenafulvalene–Et2TCNQ. J: TMDAP–FA. K: TTF–dichlorobenzoquinone. L: Perylene–F4. M: Perylene–2,3-dichloro-5,6-dicyano-p-benzoquinone. N: Perylene–tetracyanoethylene. O: Perylene–TCNQ. P: TTF–dinitrobenzene. Q: Perylene–CA. R: Pyrene–tetracyanoethylene. S: Pyrene–CA. T: Anthracene–CA. U: Hexamethylbenzene–CA. V: Naphthalene–TCNE. X: Anthracene–pyromellitic dianhydride (PMDA). Y: Anthracene–tetracyanobenzenze. Z: Phenanthrene–PMDA. The molecular structures are shown in Supplementary Fig. 1.
