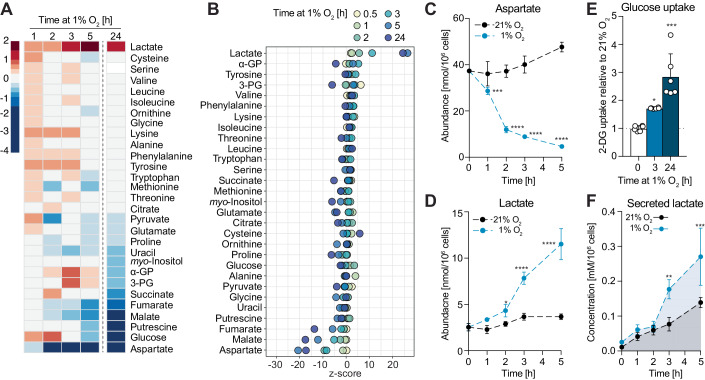
Figure 1. Increased glycolysis occurs within 3 h upon exposure to 1% O2 and correlates with decreased intracellular aspartate levels.
(A) Heatmap showing log2 fold changes of the abundance of the indicated metabolites in MCF7 cells exposed to 1% O2 for the indicated lengths of time, compared to cells at 21% O2. Metabolites are ordered according to log2 fold changes after 24 h in 1% O2. (B) Z-score plot of changes in metabolite abundances shown in (A). Metabolites are ordered according to their z-score values at 3 h in 1% O2. (C, D) Intracellular abundances of aspartate and lactate, respectively, shown in (A). See also Appendix Fig. S1A,B. (E) Glucose (2DG) uptake of MCF7 cells in 21% O2 and after 3 or 24 h in 1% O2. (F) Lactate concentration in culture media of MCF7 cells incubated in 21% O2 or 1% O2 for the indicated lengths of time. Data information: Data are representative of experiments with similar conditions performed independently N times as follows: N ≥10 (A–D, 3 h), N ≥2 (A–D other time points and E, F). Datapoints in (C, D) represent mean ± s.d. n = 4 (A–D, F) and n = 6 (E) cultures per time point and condition, except t = 0 in (F) (n = 1), which corresponds to media without cells. P values for differences between 21% vs 1% O2 were calculated by two-way ANOVA Sidak’s test (C, D, F) or one-way ANOVA Dunnett’s test (E). *P < 0.05, **P < 0.01, ***P < 0.001, ****P < 0.0001. Source data are available online for this figure.

