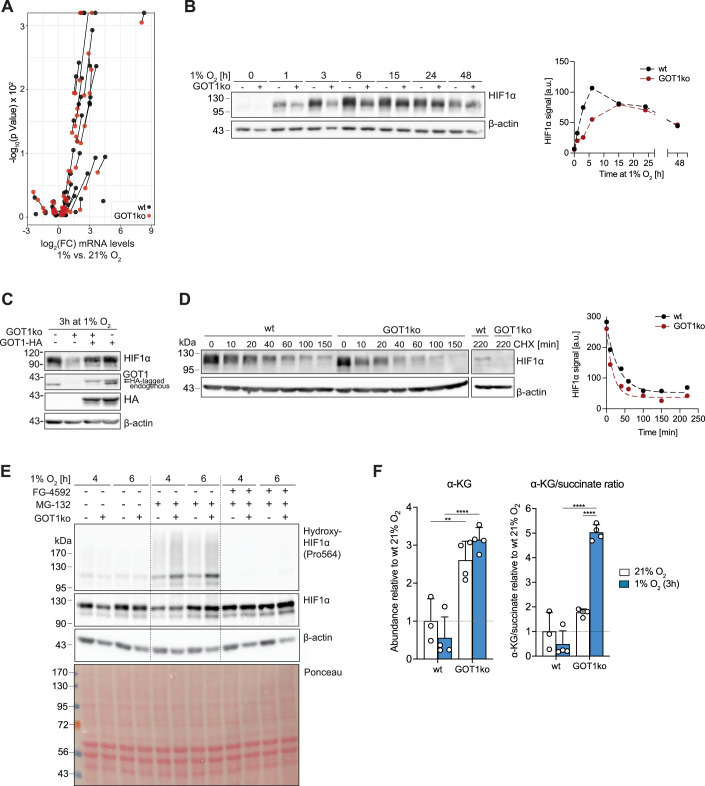
Figure 6. Elevated αKG levels, increased HIF1α hydroxylation and attenuated HIF1α stabilisation in GOT1ko cells under hypoxia.
(A) Volcano plot of gene expression changes of a panel of HIF1α target genes in wild-type (wt) MCF7 and GOT1ko cells exposed to 1% O2 for 24 h, compared to control cells in normoxia. Lines connect identical genes in the two cell lines to illustrate the differences in hypoxia-induced gene expression changes. (B) Western blot to assess HIF1α protein levels in wild-type (wt) and GOT1ko MCF7 cells exposed to 1% O2 for the indicated lengths of time. The graph on the right shows the quantification of the HIF1α signal. (C) Western blot to assess the protein levels of HIF1α, endogenous GOT1 and HA-tagged GOT1 in wild-type (wt) and GOT1ko MCF7 cells stably expressing GOT1-HA or GFP and exposed to 1% O2 for 3 h. (D) Western blot to assess HIF1α protein levels in wild-type (wt) and GOT1ko MCF7 cells exposed to 1% O2 for 3 h and then treated with cycloheximide (CHX, 20 μM) for the indicated lengths of time. Graph on the right shows the quantification of the HIF1α signal. (E) Western blot to assess the levels of HIF1α, and HIF1α hydroxylated at proline 564 (Pro564) in wild-type (wt) and GOT1ko MCF7 cells exposed to 1% O2 for the indicated lengths of time. Cells were treated with the PHD inhibitor FG-4592 (50 μM), the proteasome inhibitor MG-132 (10 μM) or a combination of both for the duration of the experiment. See also Appendix Fig. S6F for additional controls. (F) The intracellular abundance of α-ketoglutarate (α-KG, left) and corresponding αKG/succinate ratios (right) in wild-type (wt) and GOT1ko MCF7 cells after 3 h at 21% O2 or 1% O2. Data information: Data are representative of experiments with similar conditions performed independently N times as follows: N = 1 (A), N = 3 (B), N ≥ 3 (C), N = 2 (D–F). Datapoints in (F) represent mean ± s.d. n = 3 (A) and n = 4 (F) cultures for each cell line and condition. FDRs in (A) were calculated using the ’exactTest’ function of the edgeR package (see 'Methods') with a cut-off set at 1%; only changes with FDR < 0.01 are shown. The P values shown in (F) were calculated by two-way ANOVA Sidak’s test. ns non-significant, *P < 0.05, **P < 0.01, ***P < 0.001, ****P < 0.0001. Source data are available online for this figure.

