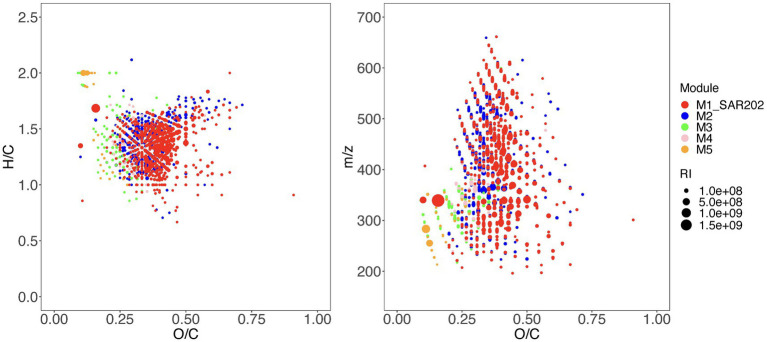
Figure 3.
Chemical characteristics of molecular formulae within the top 5 modules in the networks as shown in Figure 2. Both H/C ratio (A) and molecular mass (m/z) (B) are plotted against the O/C ratio. The molecular formulae from distinct network modules are shown in different colors and the relative intensity values of the molecular formulae at day 30 are indicated by the bubble size.

