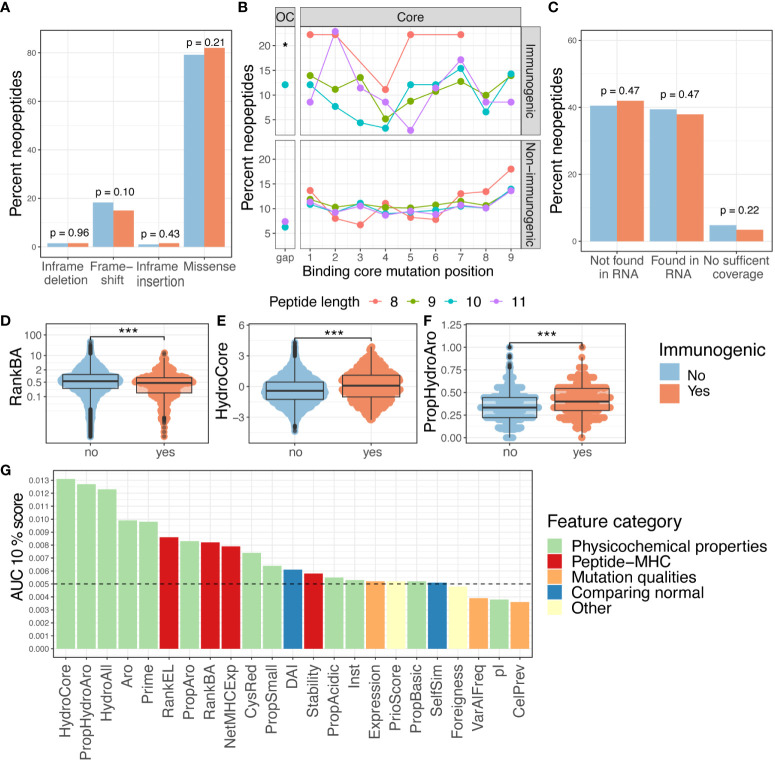
Figure 2.
Features and immunogenicity. (A) Percentage of immunogenic neoepitopes according to the mutation consequence. The p-values were calculated according to the proportion test, testing if the number of immunogenic neoepitopes for each mutation type was present in a higher fraction compared to the non-immunogenic ones. (B) Fraction of immunogenic neoepitope for all missense mutations according to peptide position and peptide length. The gap position represents the peptide outside the core (OC) and is significantly enriched for neopeptides with a length of 10 (p = 0.01, prop.test). The neopeptides are separated into immunogenic and non-immunogenic neopeptides. (C) Percent of immunogenic and non-immunogenic neopeptides where the mutation was validated in RNA. A proportion test was performed to evaluate the proportion of immunogenic neoepitopes in the different categories. (D–F) Boxplot comparing the non-immunogenic form immunogenic neopeptides for four selected features; statistics by Wilcoxon test. (D) Peptide–MHC binding affinity (RankBA) p = 8.9·10-9. (E) Hydrophobicity only in the core of the peptide (HydroCore) p = 1.6·10-12. (F) Proportion of hydrophobic and aromatic residues in the peptide (PropHydroAro) p = < 2.22·10-16. (G) Performance with the partial AUC 10% for each feature with continuous values independently colored by feature type. p values < 0.05 = *; p values < 0.001 = ***.

