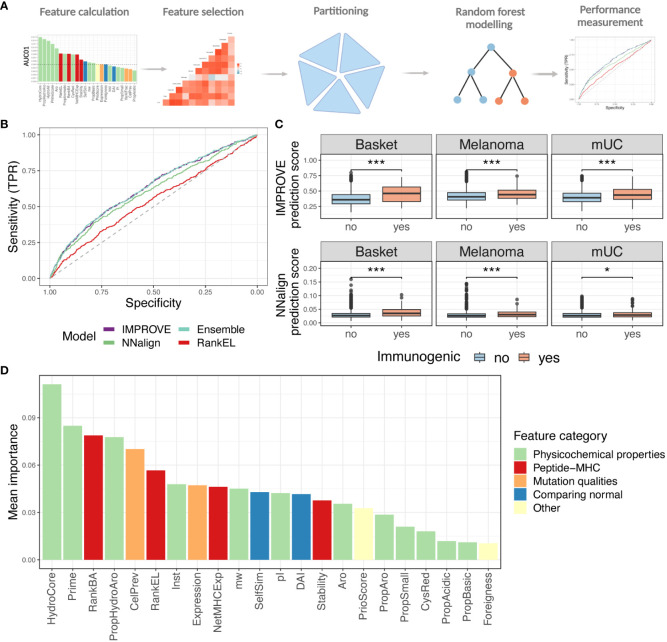
Figure 3.
Random forest modeling. (A) Strategy of the machine learning approach with feature selection, partitioning, and modeling. (B) ROC curve with the IMPROVE model in purple (AUC = 0.630 and AUC01 = 0.0139), which performs significantly better than the NNAlign in green (AUC = 0.605 and AUC01 = 0.0131) (p = 0.039, roc.test) and RankEL (AUC = 0.539 and AUC01 = 0.0086) (p = 4.3-6). An Ensemble model of NNAlign and IMPROVE was also made, resulting in a similar performance as IMPROVE (0.631 and AUC01 = 0.0139), marked in a light blue line. (C) Prediction score from the NNAlign model at the top and IMPROVE model at the bottom according to the immunogenic and non-immunogenic peptide split by cohort. The IMPROVE model had significant separation in all three cohorts, with p-values of 1.6-9, 2.3-6, and 7.1-6 for the three cohorts. All with non-paired Wilcoxon test. The NNAlign model obtained significant separation in basket trial (p = 1.0-10, Wilcoxon test) and melanoma (p = 3.8-7, Wilcoxon test) and for the mUC cohort (p = 0.019). (D) Mean feature importance for the IMPROVE model colored by the feature category. p values < 0.05 = *; p values < 0.001 = ***.

