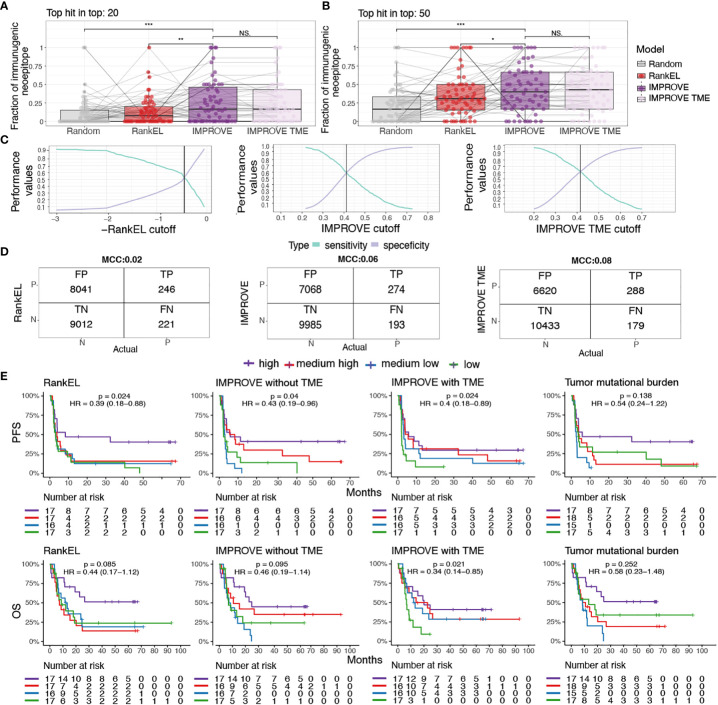
Figure 5.
Patient performance and survival. (A, B) The fraction of immunogenic neoepitopes in the top 20 and top 50 neoepitope candidates of the IMPROVE model (dark purple) and the IMPROVE TME (light purple), with red indicating eluted ligand % Rank and gray indicating randomly sampled peptides. (A) Top 20 neopeptides IMPROVE vs. RankEL (p = 0.0023), IMPROVE vs. random (p = 8.2-5), and IMPROVE vs. IMPROVE TME (p = 0.64). (B) Top 50 neopeptides IMPROVE vs. RankEL (p = 0.03), IMPROVE vs. random (p = 1.8-5), and IMPROVE vs. IMPROVE TME (p = 0.71). (C) Sensitivity and specificity calculated for the cutoff where the point the curve crosses defines the set cutoff of what is predicted to be immunogenic and non-immunogenic. (D) Confusion matrix with cutoff where the sensitivity and specificity cross. The left image shows RankEL according to the pre-selected neoepitopes with expression above 0.01. The middle image shows the IMPROVE model without TME, and the confusion matrix on the right image is the IMPROVE model with TME features included, with the defined threshold found in panel (C). (E) Kaplan–Meier curves showing all predicted neopeptides with a threshold of RankEL< 2 and Expression > 0.01, which included predicted neoepitopes that were not screened, for example, HLA alleles that were not available and neopeptides for patients selected with a more restricted threshold. The survival analysis was made for the three categories described in the confusion matrix. The patients were separated into four groups according to the number of predicted neoepitopes above the defined threshold. The four groups were determined according to the quantile, where “high” is above the third quantile, and “medium high” is between the second and third quantiles. “Medium low” is between the second and first quantiles, and low is below the first quantile. The threshold for predicted neoepitopes was set to where the sensitivity and specificity cross as shown in panel (C) and was also the threshold used in the confusion matrix. (Left) RankEL. (Middle left) The IMPROVE model without TME. (Middle right) The IMPROVE model with TME. (Right) The tumor mutational burden (TMB). p values < 0.05 = *; p values < 0.01 = **; p values < 0.001 = ***; p-values > 0.5 = NS.

