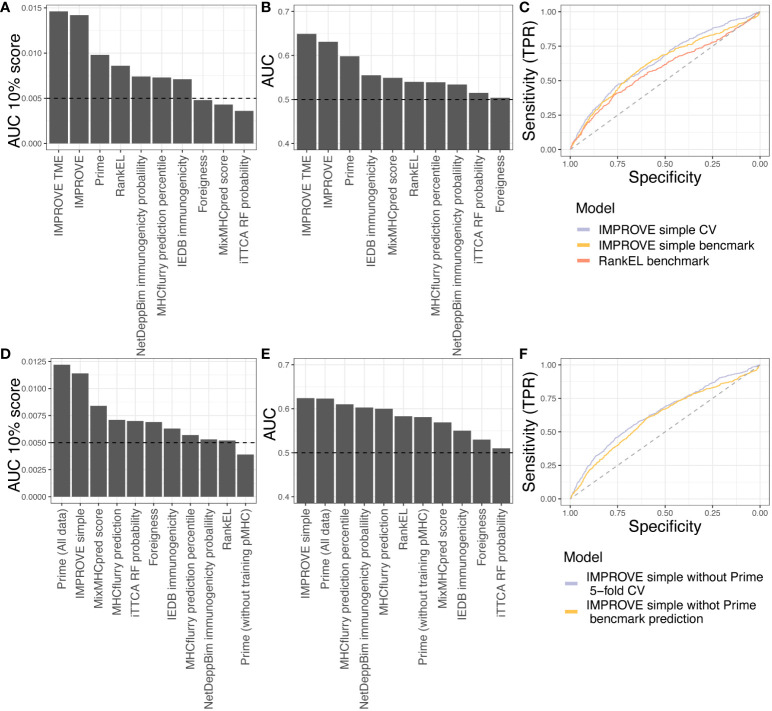
Figure 6.
Benchmark data. (A, B) Testing the in-house dataset used to train IMPROVE with other available tools. (A) Performance according to the partial AUC 10%. (B) Performance according to AUC. (C) A simple IMPROVE model was generated using cross-validation, referred to as CV, taking features only by knowing the mutated peptide, corresponding WT peptide, and the HLA allele. This only excluded the Priority Score and cellular prevalence from the original IMPROVE model without TME. This IMPROVE simple model resulted in a performance of AUC = 0.643 and AUC01 = 0.0134 and is marked in light blue. The IMPROVE simple model to predict immunogenicity from the benchmark from CEDAR data performed only a bit worse than the IMPROVE simple model and is marked in yellow (AUC = 0.625 and AUC01 = 0.0102). The prediction of the CEDAR benchmark data using IMPROVE performed significantly better (p = 0.0038, roc.test) than RankEL as colored in red (AUC = 0.586 and AUC01 = 0.0094). (D, E) Testing the CEDAR dataset using other available tools. (D) Performance according to the partial AUC 10%. (E) Performance according to AUC. (F) Retraining of IMPROVE simple model without Prime feature (purple), resulting in AUC = 0.64 and AUC01 = 0.0135, and predicting CEDAR data with the IMPROVE simple model without Prime (yellow), resulting in AUC = 0.61 and AUC01 = 0.0104.

