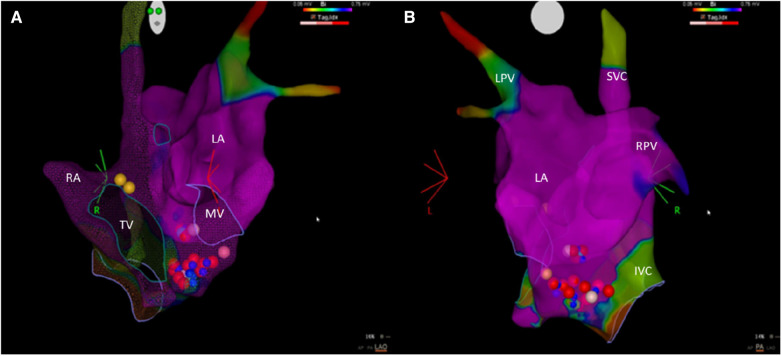
Figure 2.
An electro-anatomic mapping of the left and right atria using the CARTO system. (A) An anterior–posterior view. (B) A left-lateral view. The blue dots are regions where radiofrequency delivery caused a slowing of the narrow QRS escape rhythm. The red and pink dots are the points of ablation with an ablation index of 550 or <550, respectively. The yellow dots indicate the location of the bundle of His. IVC, inferior vena cava; LA, left atrium; LPV, left pulmonary veins; MV, mitral valve; RA, right atrium; RPV, right pulmonary veins; SVC, superior vena cava; TV, tricuspid valve.

