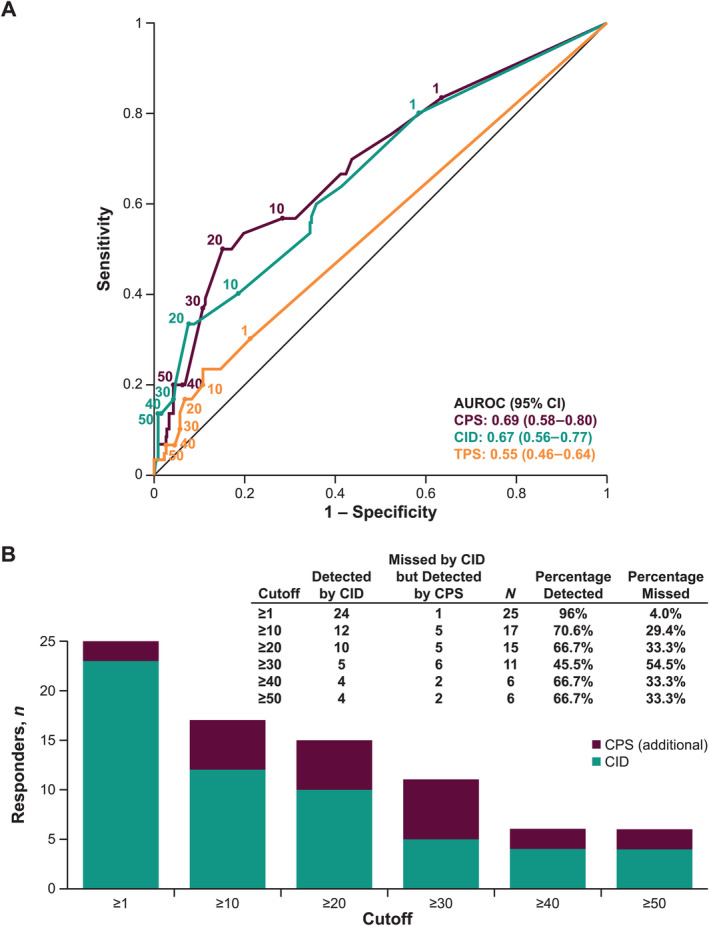
Figure 1.

(A) ROC curves by PD‐L1 scoring method in pembrolizumab‐treated patients (n = 309). Sensitivity reports the fraction of responders detected on the y axis and 1 − specificity reports the fraction of non‐responders falsely detected on the x axis. The higher the ROC curve is on the vertical axis and the further left it is on the horizontal axis, the more valid the test. A cutoff of 0 (upper right) corresponds to the detection of all responders (sensitivity = 1) but the false detection of all non‐responders (1 − specificity = 1). As the cutoff increases, a perfect test would move horizontally to the upper left corner (sensitivity = 1; 1 − specificity = 0) and then straight down. (B) Responders by cutoffs using PD‐L1 CPS and CID in pembrolizumab‐treated patients (n = 30 responders).
