Figure 2.

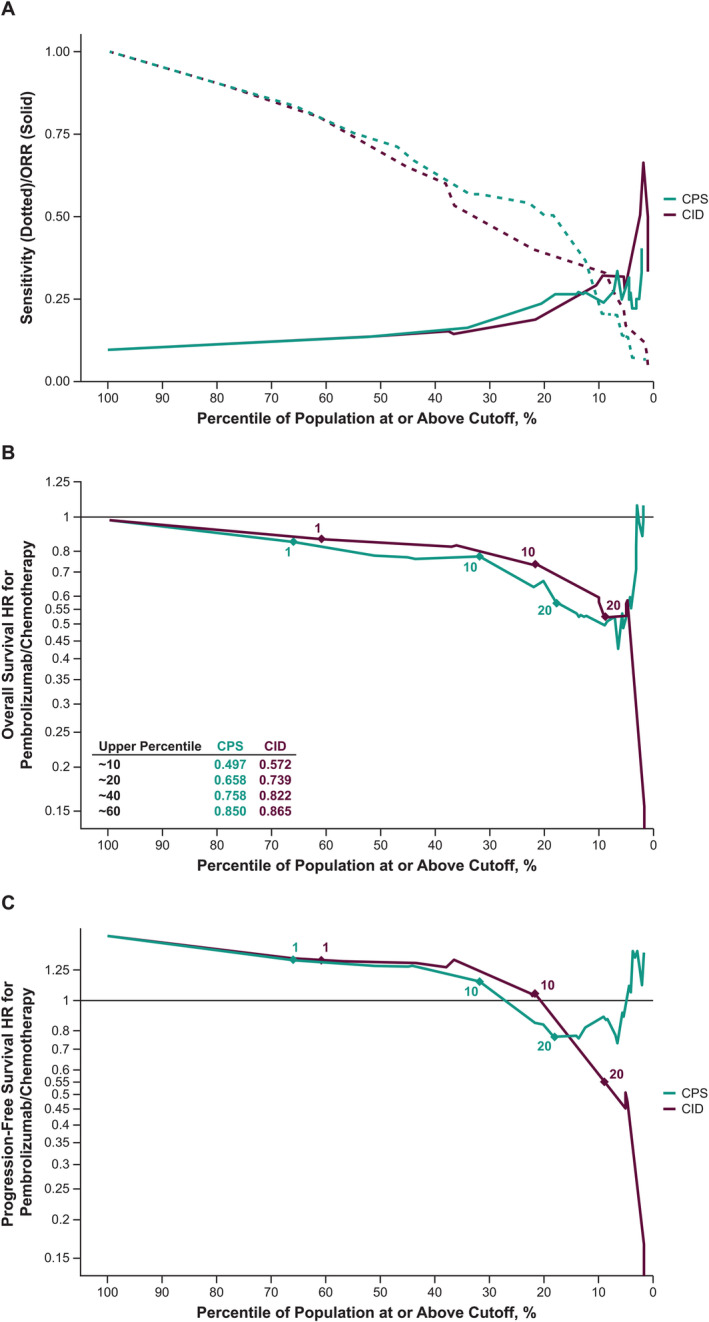
(A) Sensitivity and ORR enrichment profile; and HR (pembrolizumab/chemotherapy) profile for (B) OS and (C) PFS according to the percentage of the population identified by cutoff. The x axis shows the percentile of positive tumours.

(A) Sensitivity and ORR enrichment profile; and HR (pembrolizumab/chemotherapy) profile for (B) OS and (C) PFS according to the percentage of the population identified by cutoff. The x axis shows the percentile of positive tumours.