Figure 3.

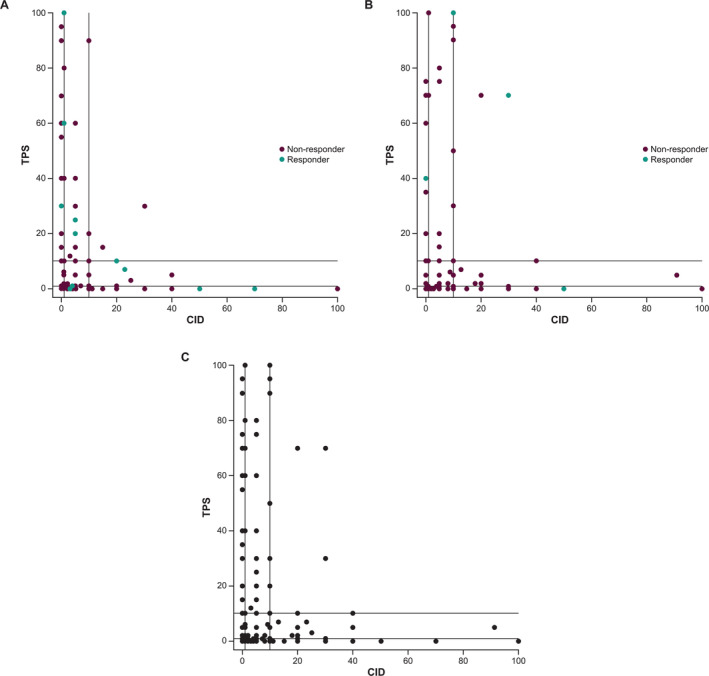
Scatterplot of PD‐L1 TPS versus CID in (A) pembrolizumab‐treated patients (n = 309), (B) chemotherapy‐treated patients (n = 292), and (C) all patients (N = 601).

Scatterplot of PD‐L1 TPS versus CID in (A) pembrolizumab‐treated patients (n = 309), (B) chemotherapy‐treated patients (n = 292), and (C) all patients (N = 601).