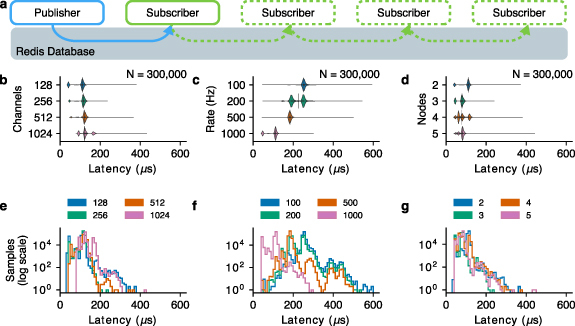
Figure 2.

BRAND achieves low-latency inter-node communication. (a) To test inter-node communication latency, a publisher node sends 30 kHz neural data (grouped in 1 ms packets) to a subscriber node via the Redis database. Violin plot of the resulting latency measurements showing that the inter-node communication latency is consistently below 600 microseconds even as (b) the channel count is scaled up to 1024 channels, (c) the sampling rate is changed, and (d) additional subscriber nodes are added. Vertical lines indicate the location of the median in each violin. Histograms of these data show the distribution of latency measurements for each (e) channel count, (f) output rate, and (g) number of nodes.
